On track for Vision 2015 and sustainable growth beyond Solid H1 results EPS up 16 per cent Order book at record high Interim dividend up 15 per cent Resilient business model Geographic structure creating new opportunities…
AMEC plc Half-year results 2013 Ian McHoul, Chief Financial Officer
Changes to reporting in 2013 New organisation structure announced October 2012 2013 results presented under new geographic structure Restated half year results for 2010 2012 also included in this presentation Rules on pensions…
Revenue by geography Versus 2012 million 2013 Headline Underlying Underlying (6 months ended 30 June) (excluding FX and (Excl. procurement) 2 acquisitions)1 Americas 1,154 -5% -7% +1% Europe 596 +7% +2% +2% Growth Regions 265…
Revenue by market Versus 2012 million 2013 Headline Underlying Underlying (Excl. (6 months ended 30 June) (excl. FX and procurement) 2 acquisitions)1 Oil & Gas 1,001 +5% +3% +14% Mining 249 -25% -26% -26% Clean Energy 474 - -7%…
EBITA margin1 2013 2012 million Headline Excl. Headline Excl. (6 months ended 30 June) procurement2 procurement2 Americas 9.8% 10.7% 9.1% 10.9% Europe 6.5% 6.5% 7.8% 7.8% Growth Regions 6.1% 6.1% 4.8% 4.8% Total 3 7.9% 8.3% 7.5%…
Europe million (6 months ended 30 June) 2013 2012 2011 Revenue - Oil & Gas 398 328 243 - Mining - 3 5 - Clean Energy 172 208 227 - Environment & Infrastructure 26 16 18 Total 596 555 493 EBITA 39 44 43 EBITA margin 6.5% 7.8%…
Europe Revenue growth (%) EBITA development (m) 2% +5% -11 +5 +1 596m 44m 39m 555m 2012 (H1) Net Forex** Organic 2013 (H1) 2012 (H1) Net Forex** Organic Margin 2013 (H1) acquisitions* acquisitions* revenue…
Growth Regions million (6 months ended 30 June) 2013 2012 2011 Revenue - Oil & Gas 175 161 128 - Mining 30 59 44 - Clean Energy 9 4 2 - Environment & Infrastructure 51 38 33 Total 265 262 207 EBITA 16 12 16 EBITA margin 6.1%…
Growth Regions Revenue growth (%) EBITA development (m) +3% +4 -2% 265m 16m 12m 262m 2012 (H1) Net Forex** Organic 2013 (H1) 2012 (H1) Net Forex** Organic Margin 2013 (H1) acquisitions* acquisitions* revenue Cost…
Tax million 2013 FY 2012 FY Estimate Actual Underlying rate1 29% 29% P&L charge2 23% 22.5% Cash paid 60m 29m Underlying rate stable Charge reducing Prudent management Cash payments normalising Sustainable rate in the mid…
Pension accounting changes to IAS 19 Return on pension assets to be based on the discount rate (ie AA corporate bond yields) irrespective of the actual asset class Effective 1 January 2013 Profit impact: 2013 2012 million FY…
Operating cash flow million 6 months ended 30 June 2013 2012 EBITA 158 152 JV EBITA (5) (12) Statutory PBIT 153 140 JV dividend received 5 6 Non-cash items1 13 14 171 160 Working capital (115) (18) Operating cash flow2 56 142…
Cash flow million (6 months ended 30 June) 2013 2012 Operating cash flow 56 142 Acquisitions and disposals* (16) (179) Interest and tax (31) 2 Dividends (36) (34) Share purchases (net) (42) (152) Other** (13) (8) Net cash flow…
Our approach to growth and returns Cash generation Dividend Leverage Progressive EBITA dividend Up to 2x growth Cover 2-2.5x EBITDA Revenue growth Surplus cash Investment Additional returns to shareholders Focused on…
Outlook Long term fundamentals positive 2013 revenue H2 underpinned by strong order book Incremental procurement 200m lower FY underlying revenue in line with 2012 Benefit from 2012 acquisitions 2013 margin expansion Strong cash…
Positioning AMEC to meet the challenges Balanced Strong customer portfolio relationships Skilled Low risk and flexible business model work force Well-placed to deliver sustainable growth 25
2015 and beyond Collaborating, improving and growing Building on our track record of delivery Positioning for sustainable growth Resilient and adaptable 26
2015 and beyond Collaborating Selling and delivering as Prioritising group Coordinated pursuit of One AMEC opportunities opportunities * Including: Including: Including: Removing silos Incentivisation Developing common…
2015 and beyond Improving Increased efficiencies Efficiencies Stronger focus on reinvested markets Monthly 2013 Dashboard GOR Health, Safety, Security, Environment Headline statistical data Summary Lookahead: YTD YTD number…
2015 and beyond Growing Sustainable presence Diversifying Developing new in Growth Regions customer base services Including: Including : Including: Middle East: strengthen Maersk (Qatar) QEDI: commissioning position Sempra…
Strategic priorities remain unchanged Fully integrate markets, sectors and services across region Americas Expand in South America Strengthen and diversify customer base Significantly increase collaboration within Americas and…
Sustainable growth beyond 2015 Skilled workforce with great customer relationships Collaborating Improving Growing Low risk Investing in skills business model Achieving and geog- raphies 100p EPS ahead of 2015 31
AMEC plc Half-year results 2013 Q&A
AMEC plc Half-year results 2013 Supplementary information
Appendix versus North American currencies 2013 2012 Change (%) Income statement Cdn 1.57 1.59 -1% US 1.53 1.58 -3% Balance sheet Cdn 1.60 1.60 in line US 1.52 1.57 -3% 34
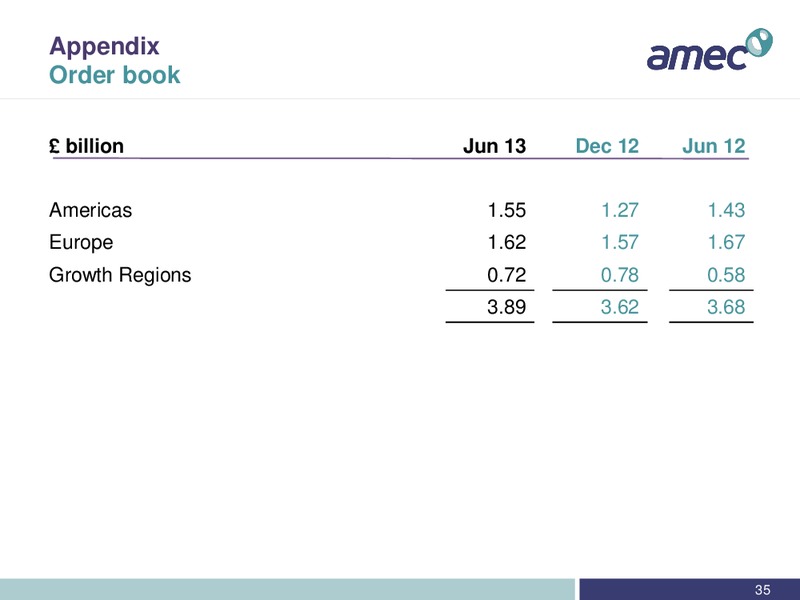
Appendix Order book billion Jun 13 Dec 12 Jun 12 Americas 1.55 1.27 1.43 Europe 1.62 1.57 1.67 Growth Regions 0.72 0.78 0.58 3.89 3.62 3.68 35
 Loading...