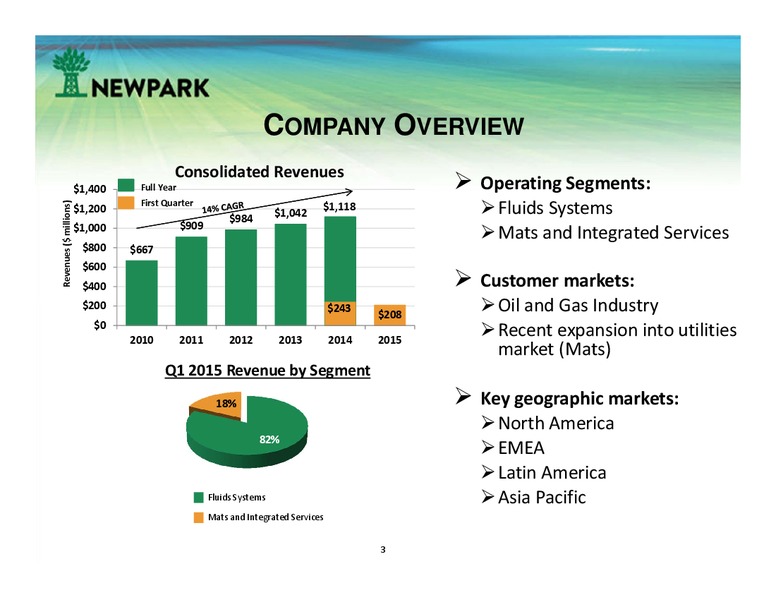
COMPANY OVERVIEW Consolidated Revenues 1,400 Full Year Operating Segments: First Quarter Fluids Systems Revenues ( millions) 1,200 1,118 984 1,042 1,000 909 Mats and Integrated Services 800 667 600 400 Customer markets:…
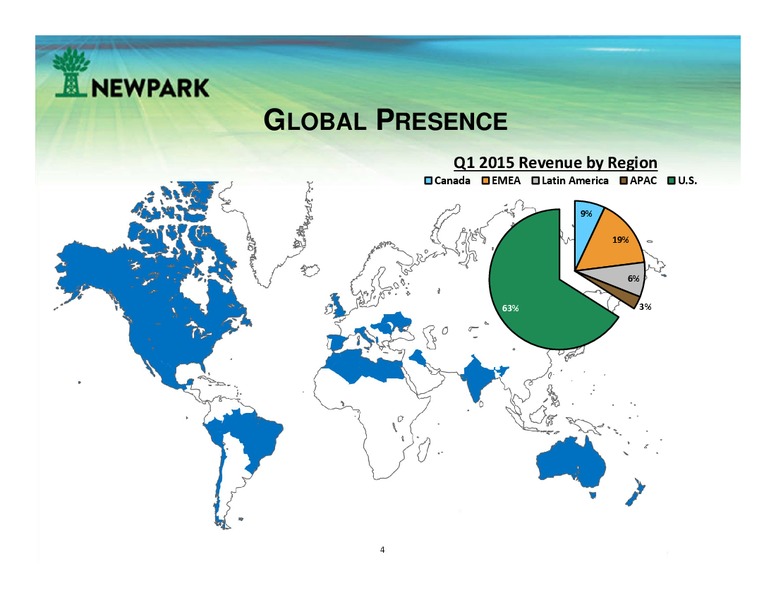
GLOBAL PRESENCE Q1 2015 Revenue by Region Canada EMEA Latin America APAC U.S. 9% 19% 6% 63% 3% 4
STRATEGIC DRIVERS TECHNOLOGY Driving to be the recognized technology leader in each of our business units Fluids Systems Our Evolution family of highperformance waterbased systems introduced in 2010 Worldwide technology center…
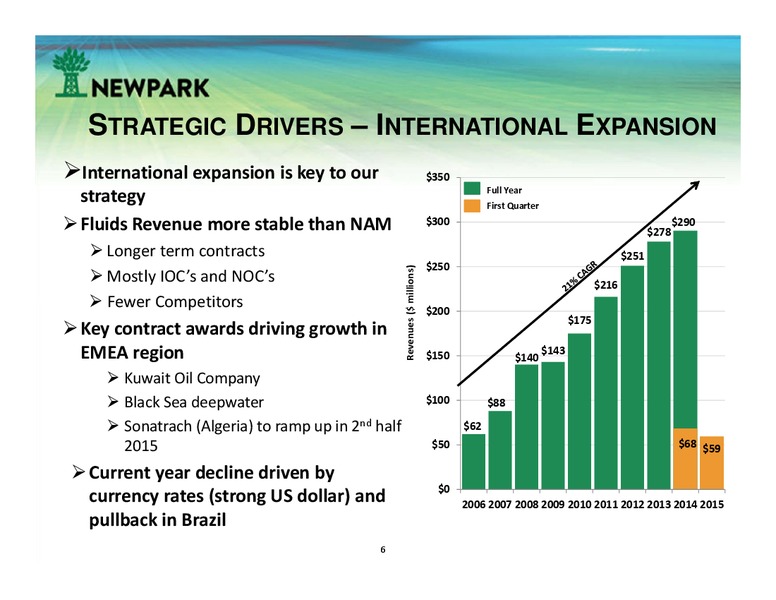
STRATEGIC DRIVERS INTERNATIONAL EXPANSION International expansion is key to our 350 Full Year strategy First Quarter Fluids Revenue more stable than NAM 300 278 290 Longer term contracts 251 250 Revenues ( millions) Mostly…
STRATEGIC DRIVERS CUSTOMER SUPPORT Focused on backing our leading technology with superior customer support Advanced training programs for fluid technicians continue to enhance product and service knowledge Strengthens…
FLUIDS SYSTEMS - OVERVIEW Largest independent drilling fluids Total Segment Revenues provider 1,200 Full Year 3rd largest drilling fluids * 1,000 First Quarter 965 company worldwide 926 862 800 799 Leading the industry in…
FLUIDS SYSTEMS NORTH AMERICA North American Revenues 800 Full Year 687 700 First Quarter 654 615 Revenue ( millions) 585 600 500 425 400 300 268 200 100 146 116 0 2009 2010 2011 2012 2013 2014 2015 Serve most North…
FLUIDS SYSTEMS EMEA Core Markets Algeria, Romania, Italy, Tunisia, Kuwait New contracts and geographical expansion driving growth Region growing in 2015 despite headwind from currency rates EMEA Revenues 180 166 Full Year 160…
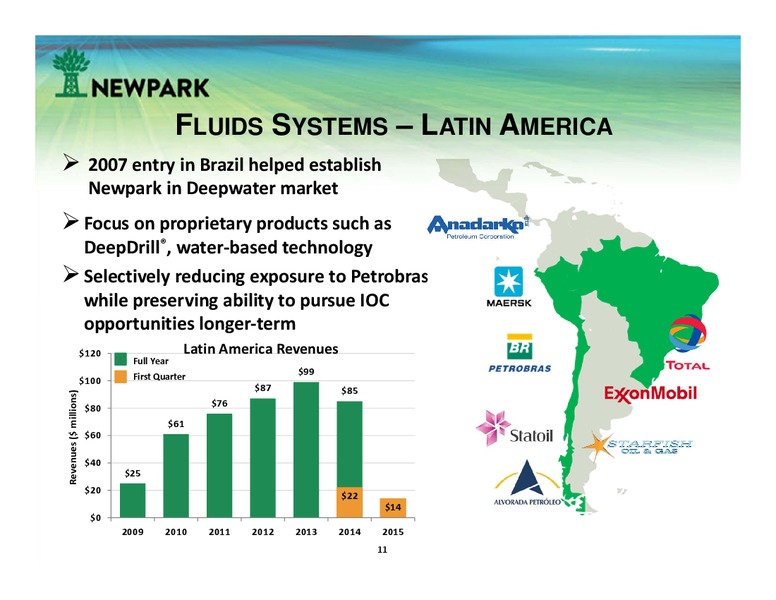
FLUIDS SYSTEMS LATIN AMERICA 2007 entry in Brazil helped establish Newpark in Deepwater market Focus on proprietary products such as DeepDrill, waterbased technology Selectively reducing exposure to Petrobras while preserving…
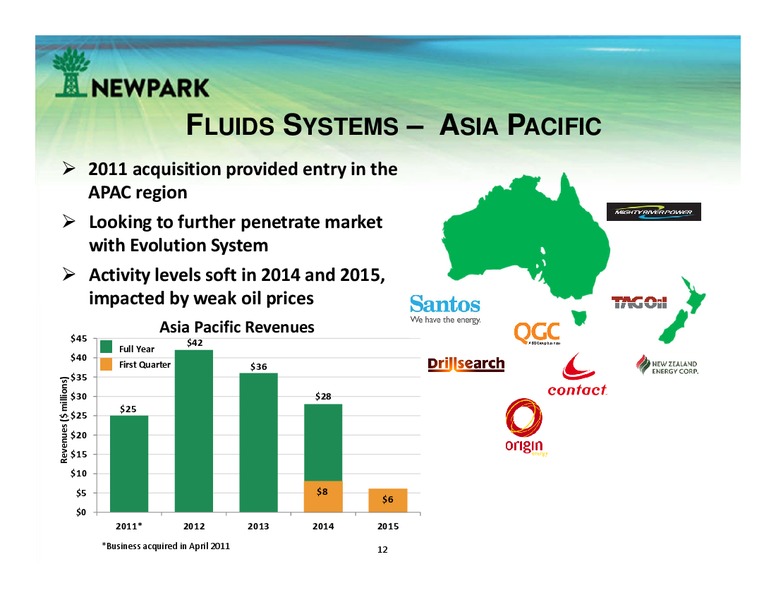
FLUIDS SYSTEMS ASIA PACIFIC 2011 acquisition provided entry in the APAC region Looking to further penetrate market with Evolution System Activity levels soft in 2014 and 2015, impacted by weak oil prices Asia Pacific Revenues…
EVOLUTION TECHNOLOGY Evolution Revenues Patented Evolution system continues 300 Full Year to demonstrate superior drilling 250 First Quarter 251 Revenues ( millions) performance 200 150 120 Premium margin compared to 100…
EXPANSION INTO DEEPWATER GOM Foundation established in Brazil Recently expanded into Black Sea Looking to leverage our experience globally, starting in Gulf of Mexico Approximately 800M drilling fluids market* Expected growth over…
MATS & INTEGRATED SERVICES Total Segment Revenues Leading provider in composite matting 180 Full Year products 160 First Quarter 153 140 Reduces operators costs and improves Revenues ( millions) 122 116 120 110…
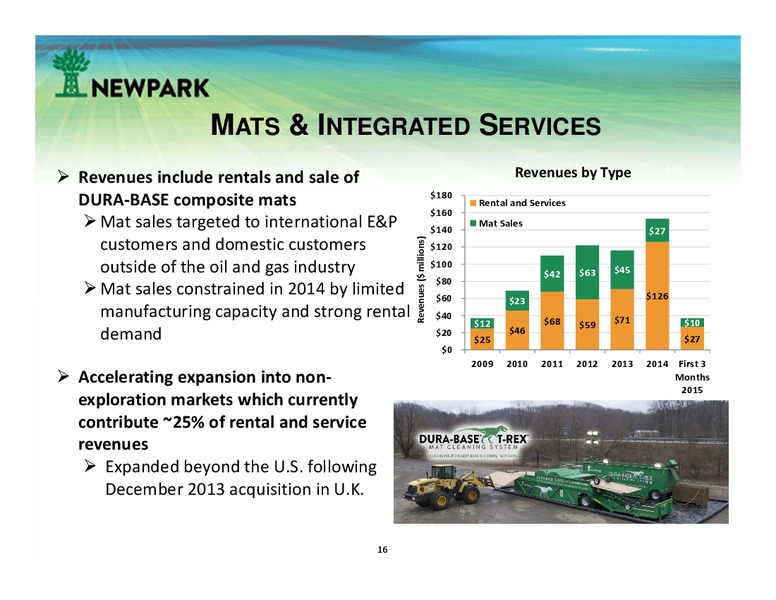
MATS & INTEGRATED SERVICES Revenues by Type 60 Revenues include rentals and sale of 180 DURABASE composite mats Rental and Services 160 Mat sales targeted to international E&P 140 Mat Sales 27 customers and domestic…
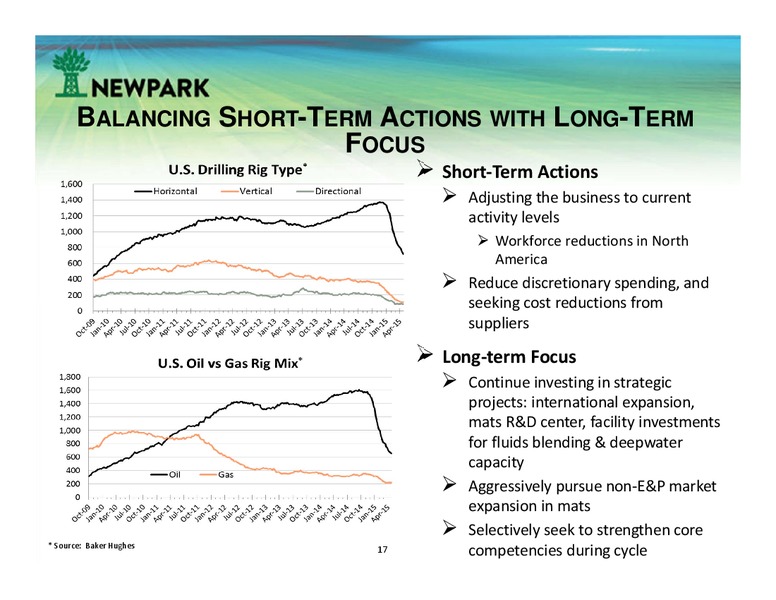
BALANCING SHORT-TERM ACTIONS WITH LONG-TERM FOCUS ShortTerm Actions Adjusting the business to current activity levels Workforce reductions in North America Reduce discretionary spending, and seeking cost reductions from…
FINANCIAL SUMMARY Revenue and EBITDA Margin* 1,200 Full Year First Quarter 1,042 1,118 18% Remaining profitable despite 984 16% 1,000 909 sharp activity decline Revenues ( millions) EBITDA Margin 14% 800 667 12% EBITDA…
APPENDIX 19
CONSOLIDATED STATEMENTS OF OPERATIONS (Unaudited) Three Months Ended March 31, December 31, March 31, (In thousands, except per share data) 2015 2014 2014 Revenues 208,464 306,162 242,824 Cost of revenues 176,634 237,067 196,560…
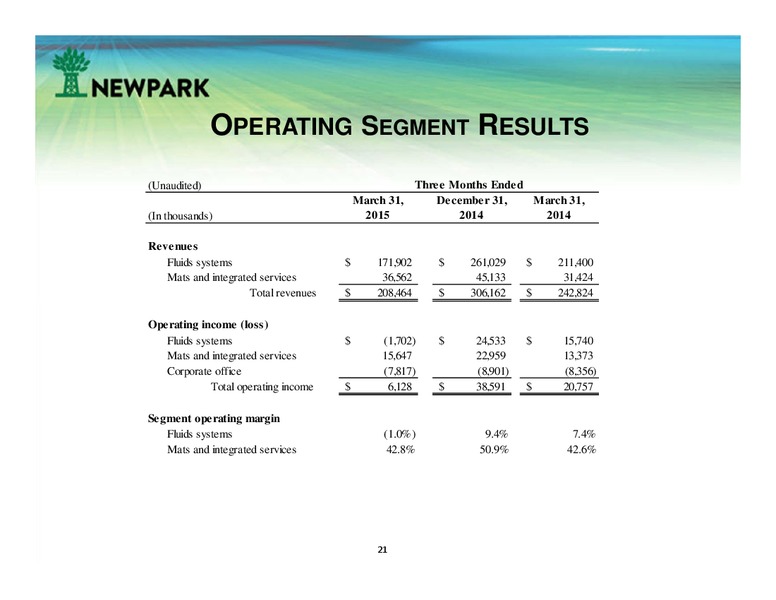
OPERATING SEGMENT RESULTS (Unaudited) Three Months Ended March 31, December 31, March 31, (In thousands) 2015 2014 2014 Revenues Fluids systems 171,902 261,029 211,400 Mats and integrated services 36,562 45,133 31,424 Total revenues…
CONSOLIDATED BALANCE SHEETS (Unaudited) March 31, December 31, (In thousands, except share data) 2015 2014 ASSETS Cash and cash equivalents 91,692 85,052 Receivables, net 260,718 318,600 Inventories 183,821 196,556 Deferred tax…
CONSOLIDATED STATEMENTS OF CASH FLOW (Unaudited) Three Months Ended March 31, (In thousands) 2015 2014 Cash flows from operating activities: Net income 993 35,011 Adjustments to reconcile net income to net cash provided by…
EXPERIENCED LEADERSHIP Paul Howes President & CEO Gregg Piontek VP & CFO Mark Airola SVP, GC & Admin Officer Bruce Smith President Fluids Systems Jeff Juergens President Mats & Integrated Services 24
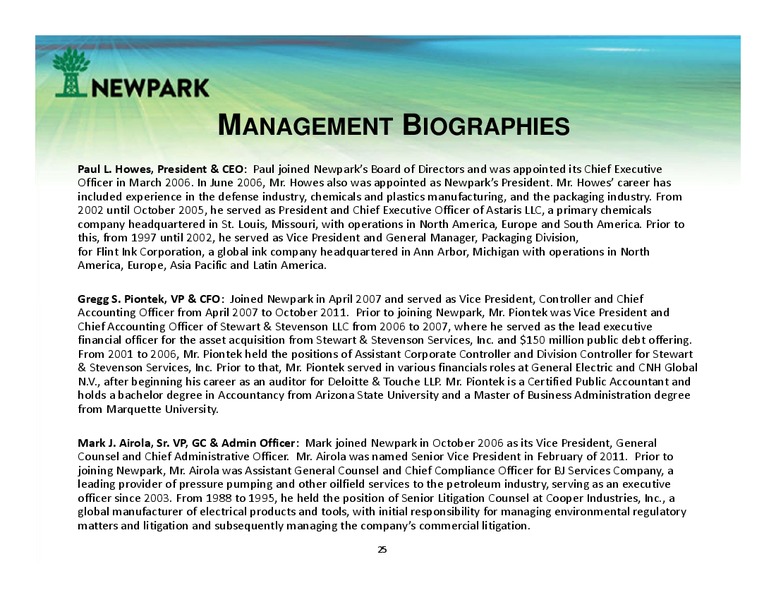
MANAGEMENT BIOGRAPHIES Paul L. Howes, President & CEO: Paul joined Newparks Board of Directors and was appointed its Chief Executive Officer in March 2006. In June 2006, Mr. Howes also was appointed as Newparks President. Mr. Howes…
MANAGEMENT BIOGRAPHIES Bruce C. Smith, Executive VP and President Fluids Systems: Bruce joined Newpark in April 1998 as Vice President, International. Since October 2000, he has served as President of its subsidiary Newpark Drilling…
 Loading...