Skip to main content Q4 2014 AND FULL YEAR RESULTS – Technip Investor Presentation | Shale Experts
Loading...

Q4 2014 AND FULL YEAR RESULTS – Technip

Technip · Feb 18, 2015 · 27 slides

Investor presentation from the Shale Experts oil & gas presentation and slide database. Every page is imaged and its text indexed for search across operators, plays, basins and time.

Slides

  1. Q4 2014 AND FULL YEAR RESULTS – Technip – slide 1
    Fourth Quarter and Full Year 2014 Results Paris, February 18, 2015
  2. Q4 2014 AND FULL YEAR RESULTS – Technip – slide 2
    Contents 2014 Full Year Review 2014 Operational & Financial Highlights Changing Market Environment: Shaping Technips Business Engaging with Clients 3 4Q & FY 2014 Results
  3. Q4 2014 AND FULL YEAR RESULTS – Technip – slide 3
    2014 Full Year Review 4 4Q & FY 2014 Results
  4. Q4 2014 AND FULL YEAR RESULTS – Technip – slide 4
    Technips Financial Performance in 2014 Objectives Financial Performance Adjusted revenue between 4.35 and 4.75 billion Adjusted revenue at 4.9 billion Subsea Subsea Adjusted operating margin at least 12% Adjusted operating margin at…
  5. Q4 2014 AND FULL YEAR RESULTS – Technip – slide 5
    Technips Operational Performance in 2014 Key focus areas Operational Performance Subsea US Gulf of Mexico, Panyu, Greater Delivering our projects Western Flank Onshore/ Offshore Jubail, Heidelberg, PMP Delivering our projects…
  6. Q4 2014 AND FULL YEAR RESULTS – Technip – slide 6
    Proposed Dividend Increase of 8% Dividend per share () CAGR: +9% 2.00(1) 1.85 1.68 1.58 1.45 1.35 1.20 2008 2009 2010 2011 2012 2013 2014 Technip is committed to a progressive dividend policy Shareholders offered an…
  7. Q4 2014 AND FULL YEAR RESULTS – Technip – slide 7
    Backlog Provides Visibility Beyond 2015 Subsea 4Q 2014 Order Intake: 1.3 billion 9.7 billion 4.9 billion 2.8 billion 2.0 billion 2015 2016 2017 & beyond Onshore & Offshore 4Q 2014 Order Intake: 1.9 billion 11.2 billion…
  8. Q4 2014 AND FULL YEAR RESULTS – Technip – slide 8
    2014 Operational & Financial Highlights 9 4Q & FY 2014 Results
  9. Q4 2014 AND FULL YEAR RESULTS – Technip – slide 9
    Fourth Quarter Subsea Highlights million Overall group vessel utilization rate Adjusted Revenue 74% in 4Q14 versus 69% a year ago 80% for the full year 2014 1,290 963 963 Offshore campaigns Block 15/06, Angola + 34% Quad 204,…
  10. Q4 2014 AND FULL YEAR RESULTS – Technip – slide 10
    Fourth Quarter Onshore/Offshore Highlights million Engineering / Procurement Adjusted Revenue Yamal LNG, Russia Maharaja Lela & Jamalulalam South gas 1,514 1,514 1,526 development, Brunei JBF Mangalore PTA plant, India + 1%…
  11. Q4 2014 AND FULL YEAR RESULTS – Technip – slide 11
    Foreign Exchange Management 2014 Revenues by Currency(1) Most projects are multi- EUR 17% currency and naturally 32% hedged USD & USD pegs 26% BRL, GBP, NOK BRL/GBP/NOK All currency flows are hedged at contract signature or as…
  12. Q4 2014 AND FULL YEAR RESULTS – Technip – slide 12
    Fourth Quarter & FY 2014: Group Financial Highlights million Y-o-Y Y-o-Y 4Q 14 Change FY 14 Change Full year main elements: Adjusted Revenue 2,816 14% 10,725 16% Subsea adjusted revenue grew 20% Adjusted EBITDA(1) 319 21% 1,108…
  13. Q4 2014 AND FULL YEAR RESULTS – Technip – slide 13
    Full Year Underlying Net Income of 564 million(1) Non-current items Group Net Income (in million) Sale of TPS engineering services for 9 buildings and infrastructure Other 68 Divestment of India diving business 16 MHB (75%…
  14. Q4 2014 AND FULL YEAR RESULTS – Technip – slide 14
    Fourth Quarter 2014 & FY 2014: Cash Flow million million 3 Months 12 months September December 2014 2014 Net Income / (Loss) (including 83 442 Non-Controlling Interests) Adjusted Net Adjusted Net Adjusted Depreciation & 96…
  15. Q4 2014 AND FULL YEAR RESULTS – Technip – slide 15
    Changing Market Environment: Shaping Technips Business 16 4Q & FY 2014 Results
  16. Q4 2014 AND FULL YEAR RESULTS – Technip – slide 16
    Operational Flexibility: Procurement and Workforce Major Procurement Categories Technip Workforce Worldwide Third party vessels 40,000 40 000 Pipes and valves Compressors, turbines, pumps Subsea equipment 37 500 37,500 Raw…
  17. Q4 2014 AND FULL YEAR RESULTS – Technip – slide 17
    Flexibility in Fleet Management 2013 2014 2015 2016-2017 New +2 +1 Divested -3 -8 -2 -2 Wholly-owned 19 11 9 8 New +2 +4 Jointly-owned 3 5 5 9 Normand Commander -1 Normand Pioneer Skandi Achiever Lease extension options…
  18. Q4 2014 AND FULL YEAR RESULTS – Technip – slide 18
    Capex Discipline and Cost Control Capex Costs Continued focus on manufacturing and logistics SG&A* fell by 69 million in 2014 Decision on second replacement diving vessel on o 6.0% of revenue in 2014 vs. 7.7% of revenue in 2013…
  19. Q4 2014 AND FULL YEAR RESULTS – Technip – slide 19
    Changing Market Environment: Engaging with Clients 20 4Q & FY 2014 Results
  20. Q4 2014 AND FULL YEAR RESULTS – Technip – slide 20
    Technip showed Strong Order Intake in the Fourth Quarter million Onshore / Offshore Order intake Ethane cracker and derivatives complex, EP&Cm, 1,957 Louisiana, USA 1 586 1,586 Oil and gas terminal for Vashishta & S1 fields,…
  21. Q4 2014 AND FULL YEAR RESULTS – Technip – slide 21
    Worldwide Presence across Multiple Markets Addressing all Clients Diversified by Geography Diversified Divrsfied By Market Backlog Split 19% Deepwater 23% Deepwater Americas 29% Americas 1,000 meters* 1,000 meters* 29% Asia…
  22. Q4 2014 AND FULL YEAR RESULTS – Technip – slide 22
    Portfolio of Solutions Adapted for our Clients Technology Conceptual and FEED Project Management Consultancy Vessel services EP&Cm Manufacturing EPCI Projects EPC Projects (Subsea) (Onshore / Offshore) Diversified revenue…
  23. Q4 2014 AND FULL YEAR RESULTS – Technip – slide 23
    Optimize Cost- and Schedule-Driven Projects Conceptual studies FEED EPC(I) / Services Design cost-effective project execution plans by engaging early: Genesis and Technip Stone & Webster Process Technologies Offer Integrated…
  24. Q4 2014 AND FULL YEAR RESULTS – Technip – slide 24
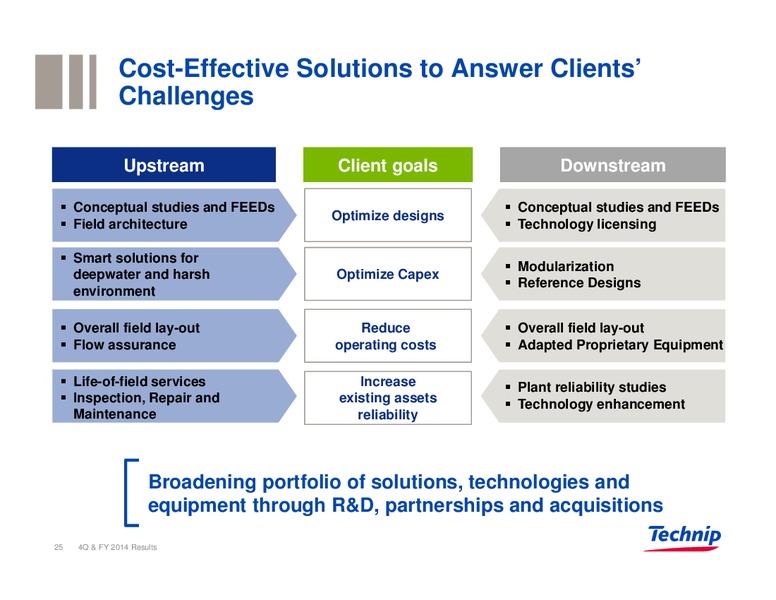
    Cost-Effective Solutions to Answer Clients Challenges Upstream Client goals Downstream Conceptual studies and FEEDs Conceptual studies and FEEDs Optimize designs Field architecture Technology licensing Smart solutions for…
  25. Q4 2014 AND FULL YEAR RESULTS – Technip – slide 25
    2015 Objectives Aligned with Previous Guidance Subsea Adjusted revenue between 5.2 and 5.5 billion Adjusted operating income from recurring activities(1) between 810 and 840 million A much stronger 1Q than a year ago Onshore /…
  26. Q4 2014 AND FULL YEAR RESULTS – Technip – slide 26
    Starting 2015 in a Strong Position Technology A record backlog of projects to deliver Key differentiating assets Actions in place to reduce our costs Execution capability Capex discipline reinforced Vertical integration Engaging…

  27. Q4 2014 AND FULL YEAR RESULTS – Technip – slide 27
    Thank you Paris, February 18, 2015

From the store

Browse maps, data & reports in the Shale Experts store