Earnings Presentation Fourth Quarter and Full Year 2012 March 14, 2013 12:00 noon UK time
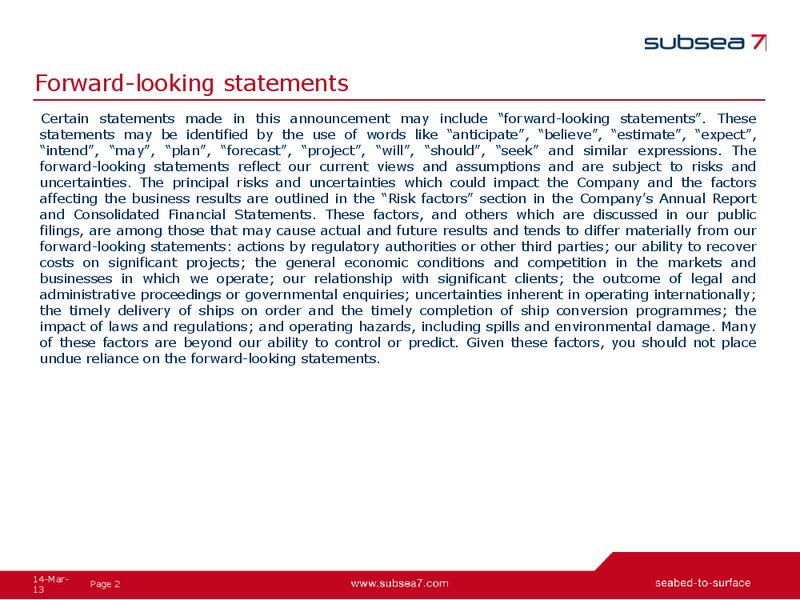
Forward-looking statements Certain statements made in this announcement may include forward-looking statements. These statements may be identified by the use of words like anticipate, believe, estimate, expect, intend, may, plan,…
2012: a year of significant achievement Delivered strong results in-line with expectations 20% growth in revenue, 16% growth in Adjusted EBITDA* Built record backlog while maintaining discipline when tendering Successfully completed…
Delivered solid Q4 2012 results Solid results reflect: - High activity levels in North and Norwegian Seas; albeit mitigated by - execution of lower margin contracts awarded in previous years - lower NSC vessel utilisation (88% in Q4…
Focused on building quality backlog Backlog progression (million) Backlog by Award Date Backlog by Execution Date Backlog by Service Capability Backlog by Segment 2011 2015+ SURF 33% 21% NSC 70% 2010 41% AFGoM 20% 2013 31%…
Momentum in orders has continued into Q1 2O13 - Western Isles contract for Dana Petroleum - 300 million - Mexico contract for Pemex - 140 million - Ehra North contract for Exxon value not disclosed - Oseberg Delta contract for…
Income statement key highlights Twelve Thirteen Three months Ended months months ended ended 31.Dec.12 31.Dec.11 31.Dec.12 31.Dec.11 In millions, unless indicated Unaudited Unaudited Audited Audited Revenue 1,611 1,417 6,297 5,477…
Territory performance Q4 2012 699m 88m Revenue NOI 611m 55m 18m 97m Revenue NOI 241m (29)m Revenue NOI Revenue NOI Note: excludes contribution from Corporate segment 14-Mar- Page 8 13
Territory performance FY 2012 2,838m 364m Revenue NOI 2,182m 278m 46m 428m 987m Revenue NOI (25)m Revenue NOI Revenue NOI Note: excludes contribution from Corporate segment 14-Mar- Page 9 13
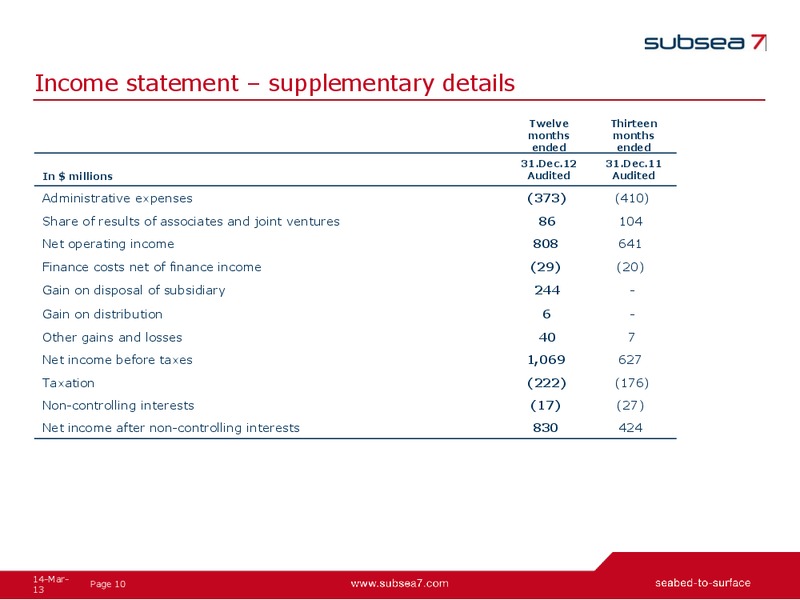
Income statement supplementary details Twelve Thirteen months months ended ended 31.Dec.12 31.Dec.11 In millions Audited Audited Administrative expenses (373) (410) Share of results of associates and joint ventures 86 104 Net…
Overview of Full Year 2012 cash flow Net cash generated from operating activities: 515m - increase in net operating assets: 356m Net cashflow used in investing activities: 354m - capital expenditure of 713m: Seven Borealis, Seven…
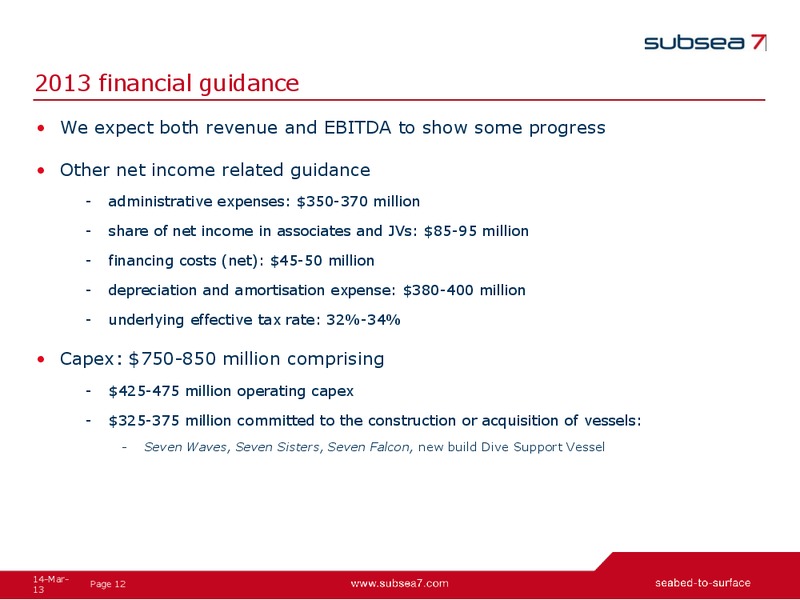
2013 financial guidance We expect both revenue and EBITDA to show some progress Other net income related guidance - administrative expenses: 350-370 million - share of net income in associates and JVs: 85-95 million - financing…
Outlook for the sector in 2013 We expect levels of tendering to remain strong with improved pricing, and we are positive about medium-term and long-term market prospects As previously highlighted, we expect the outlook in 2013 to be…
2013 outlook by Territory NSC: we expect levels of tendering to remain high with improved pricing, however - for backlog built late in 2012 we expect offshore activity largely after 2013 - we expect certain supply chain bottlenecks…
2013 outlook by Territory (continued) AFGOM: we expect levels of tendering to remain high with improved pricing, however - we expect West Africa to experience a period of lower offshore activity as operations on contracts awarded in…
Fleet upgrade programme since Jan 2011 Seven Borealis active on CLOV, Seven Viking on long term Statoil contract Seven Waves joining fleet in 2014, new DSV joining fleet in 2015 SURF Conventional Life-of-Field Divest / Release…
Summary 2012 was a year of significant achievement for Subsea 7 We remain positive about medium-term and long-term market prospects We expect to deliver progress in Revenue and Adjusted EBITDA in 2013 but, as previously highlighted,…
Major project progression Continuing projects 100m between 5% and 95% complete as at 31 Dec 2012 excl. long-term ship charters and Life-of-Field day-rate contracts. * joint venture activity 14-Mar- Page 20 13
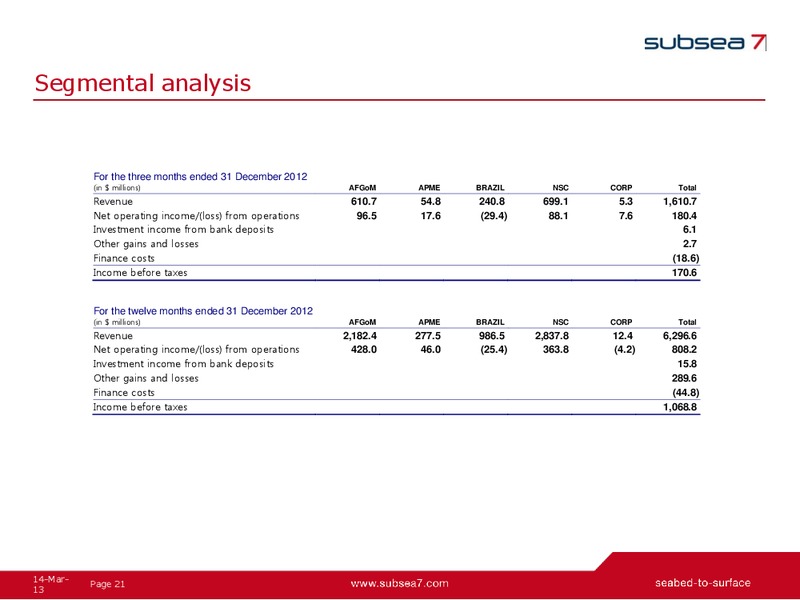
Segmental analysis For the three months ended 31 December 2012 (in millions) AFGoM APME BRAZIL NSC CORP Total Revenue 610.7 54.8 240.8 699.1 5.3 1,610.7 Net operating income/(loss) from operations 96.5 17.6 (29.4) 88.1 7.6 180.4…
Adjusted EBITDA The Group calculates adjusted earnings before interest, taxation, depreciation and amortisation (Adjusted EBITDA) as net income plus finance costs, other gains and losses, taxation, depreciation and amortisation and…
Reconciliation of net operating income to Adjusted EBITDA Three Months Three Months Twelve Months Thirteen Months Ended Ended Ended Ended 2012 2011 2012 2011 31 Dec 31 Dec 31 Dec 31 Dec For the period (in millions) Unaudited…
 Loading...