Presentation to the Financial Community First Half 2010 Results July 2010
Forward-Looking Statements Forward-looking statements are based on a number of assumptions and expectations that could ultimately prove inaccurate, as they are subject to risks and variables, outside the companys control, that could…
Presentation Outline First Half 2010 Financial Results and Backlog Analysis Oil & Gas Industry Market Outlook Recent Developments influencing the Oil Services Sector Dynamics a-Macondo Impact on DW Drilling Activities b-M&A…
First Half 2010 Financial Results and Backlog Analysis 4
Financials (Mln ) Revenues EBITDA EBIT Net Profit 5385 5158 864 802 % on % on Revenues Revenues 627 194 (7.6%) 582 % on Revenues % on Revenues 164 (6.8%) 2406 2555 138 (5.7%) 176 (6.9%) 90 (27.7%) 81 (30.1%) 31 (11.5%)…
Backlog Analysis Saipem Exposure to High Quality - Resilient Markets by Client Backlog 20.40 Bln by Year of Execution 1% 2% June, 30 2010 26% 22% 58% 39% 17% 35% Major & Supermajor National 2010 2011 2012 2013+ Independent…
Oil & Gas Industry Market Outlook 9
Oil & Gas Industry Market Outlook Oil Price stabilizing Natural Gas still weak 175 150 LEGEND: Oil - WTI Tentative steps towards Spot Price Natural Henry Hub sustainable economic recovery 125 Base 100 Gas 2 Jan. 08 Zeebruge…
Recent Developments influencing the Oil Services Sector Dynamics a-Macondo b-M&A Activity in Offshore Sector c-Strong momentum in Onshore Sector 11
a-Macondo - Impact on DW Drilling Activities - 15% of reserves of Majors and 25% of new fields production estimated to be in Deepwater % Deep water total Oil output % DW Oil output 9.0% 8.8% from fields initiating production 25%…
a-Macondo - Impact on Saipem - No direct exposure to US GoM drilling market (not a target market for Saipem) Long-term contract house policy for Deepwater Rigs Rig type Pre-Capex DW Fleet Capex Plan 2006-2011 DW Fleet Rig…
b-M&A Activity in Offshore Sector Consolidation in Field Development segment beneficial for the whole industry Reduced number of stronger contractors More appropriate pricing of risks reduced pressure on margins in a weak…
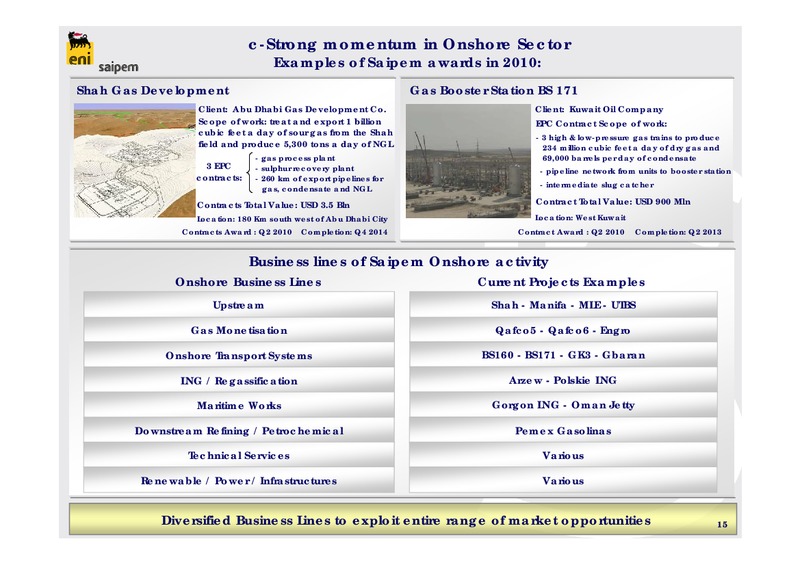
c-Strong momentum in Onshore Sector Examples of Saipem awards in 2010: Shah Gas Development Gas Booster Station BS 171 Client: Abu Dhabi Gas Development Co. Client: Kuwait Oil Company Scope of work: treat and export 1 billion EPC…
c-Strong momentum in Onshore Sector Saipem - Exploiting Unique E-P-C Industrial Model Preserve Margin Profile in Competitive Environment Industrial Model Forward Flexibility & Cost Effectiveness Engineering Impressive Development…
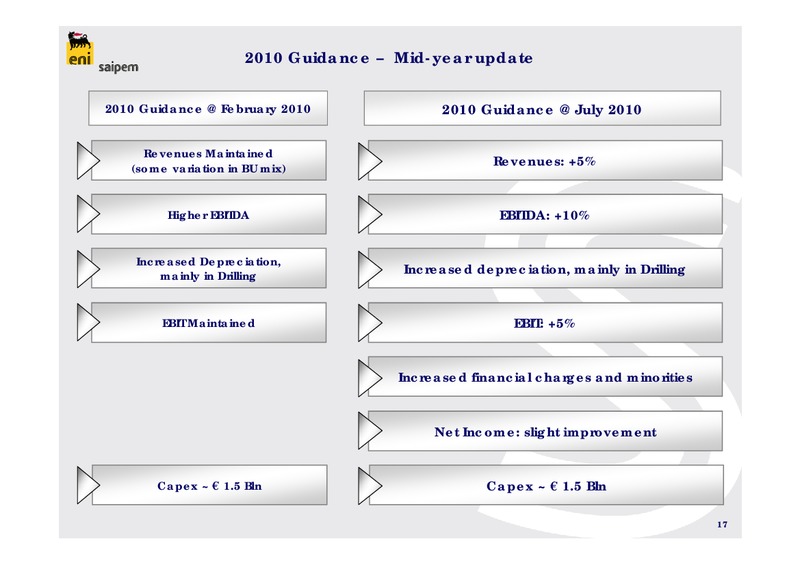
2010 Guidance Mid-year update 2010 Guidance February 2010 2010 Guidance July 2010 Revenues Maintained (some variation in BU mix) Revenues: +5% Higher EBITDA EBITDA: +10% Increased Depreciation, mainly in Drilling Increased…
Conclusions 18
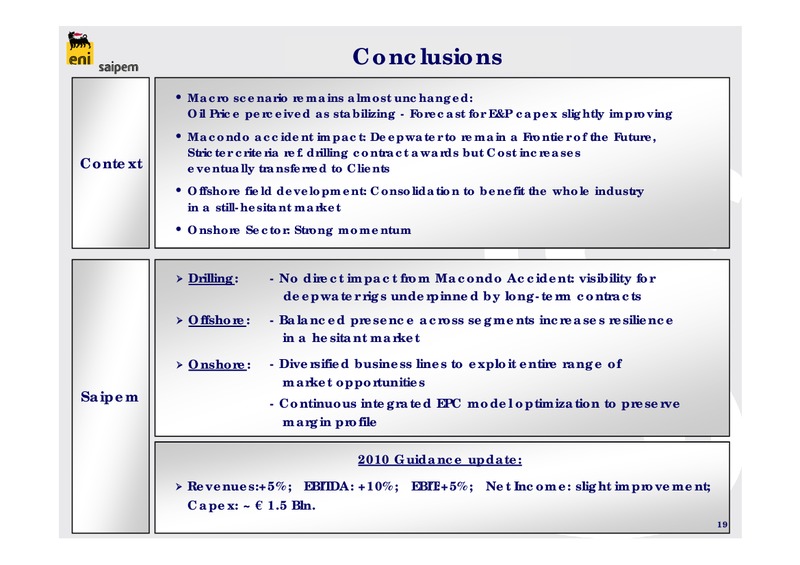
Conclusions Macro scenario remains almost unchanged: Oil Price perceived as stabilizing - Forecast for E&P capex slightly improving Macondo accident impact: Deepwater to remain a Frontier of the Future, Stricter criteria ref.…
 Loading...