Drop in Rig Count Felt in Q1 2015 2015 activity decline in Q1 2015 Q4 2014 Q1 2014 perspective against strong ( in 000s, except per unit) growth from prior year Revenues 102,111 130,929 70,578 EBITDA 29,581 44,567 23,942 Decline in…
Balance Sheet Remains Strong Leverage (as of March 31, 2015) ( in 000s) Cash 4,913 1 Revolver 12,500 2 Term loan 196,259 Other notes payable 3,676 Total debt 212,435 Net debt 207,522 Net debt / LTM EBITDA 1.35x (1)…
Committed to Long-Term Distribution Growth Distribution declared for Q1 2015 held flat Annualized rate of 2.70 per unit up 12.5% over distributions of 2.40 per unit paid in 2014 Distribution increases possible when market visibility…
Coverage Maintained During Tough Quarter Maintaining and prudently growing distributions to unit holders are key priorities Coverage ratio averaging 1.23x since Q1 2013, above target coverage of 1.20x Strong coverage in prior quarters…
Industry Backdrop
Fundamentals Still Support Long-Term Demand E&P operators are using fracture stimulation techniques, such as longer laterals, increased frac stages per well, increased proppant per stage, and infill drilling to drive well performance…
Timing & Magnitude of Recovery Remain Unclear Since the peak in U.S. land rigs, rig count has dropped for 23 consecutive weeks Vertical rig count has decreased by 68% Directional rig count has declined by 55% Horizontal rig count has…
Current Environment Continued supply chain improvements and market share consolidation Oilfield service providers still seeking efficiencies through supply chain enhancements Sand suppliers working with customers to lower all-in…
Hi-Crush Operations
Hi-Crushs Competitive Advantages Long-Term Contracted Cash Flow 8 Long-Term Contracts, 4.2 Average Years Remaining Low-Cost Producer 75% of Production Capacity Contracted Long-Lived, High Quality Reserves Long-Term Northern…
Logistics Flexibility Critical Access to all major North American oil and gas basins Sponsors Direct loading and unloading of unit Whitehall Facility trains Sandstone Multiple in-basin terminals across Formations Marcellus…
A Strategy for the Current Market Northern White still in highest demand relative to other proppant types Migration to in-basin sales as a way for customers to lower supply chain costs Organic growth of distribution network…
Financial Results
1st Quarter 2015 Summary Three Months Ended March 31, 2015 2014(a) Revenues 102,111 70,578 Cost of goods sold (including depreciation, depletion and amortization) 68,639 44,166 Gross profit 33,472 26,412 Operating costs and…
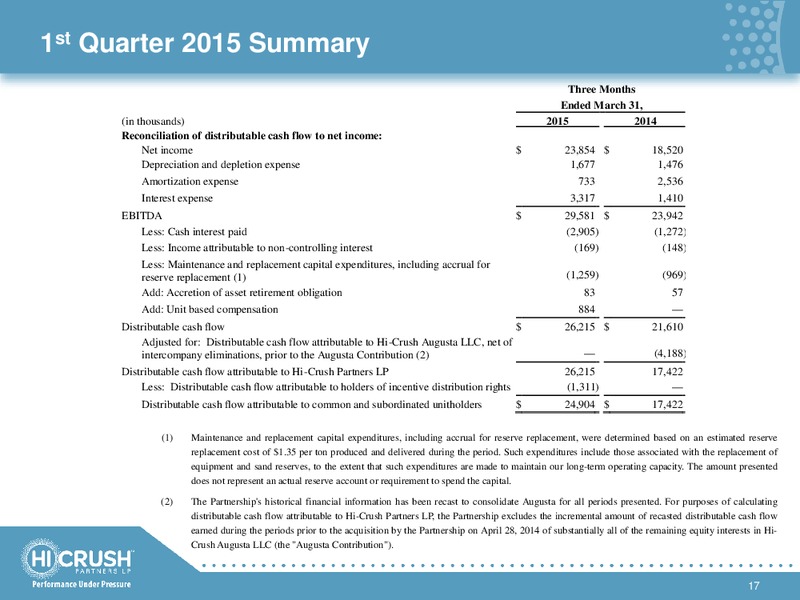
1st Quarter 2015 Summary Three Months Ended March 31, (in thousands) 2015 2014 Reconciliation of distributable cash flow to net income: Net income 23,854 18,520 Depreciation and depletion expense 1,677 1,476 Amortization expense…
 Loading...