ORIGIN ENERGY INTERNATIONAL ROADSHOW Grant King, Managing Director Karen Moses, Executive Director, Finance and Strategy May 2015
Origins strategy of connecting resources to markets is pursued through a clear focus on its 3 businesses and 4 priorities designed to drive continued improvement in Origins performance A regionally A growing A regional leader…
Origins strategy of connecting resources to markets is pursued through its 3 businesses FY20 14 FY2014 ENERGY MARKETS EBITDA1 Net Assets1,2 Australias leading integrated energy retailer 29% of electricity and gas NEM market share3…
Within the 3 businesses Origin is focused on delivering 4 key priorities Build customer loyalty and trust to mitigate market 1 competition 4 IMPROVING RETURNS Capture value of a strong gas position in a rising CAPITAL IN ENERGY…
1.Improving Improving returns in energy markets businesses 6
Building customer loyalty and trust is the most powerful mitigant to the impacts of a highly competitive market Digital Transformation Customer Communication 34 point 5% improvement in improvement in Net on time payment…
Implementation of new technology has improved communication with customers, allowing greater focus on retention activities through use of internal channels, resulting in improved service to customers and cost to serve benefits…
The retail environment remains challenging with elevated levels of discounting Electricity and Natural Gas Churn Rates Origins Average Signed Discount Offers for Electricity and Natural Gas (%) VIC 25% 20% NSW SA 15% 10%…
Origin has a competitive cost of gas through its diverse and flexible gas portfolio and continues to capture benefits of rising gas prices, near term ramp gas opportunities, increasing sales volumes and market share ... Natural Gas…
Origin has a competitive cost of electricity through its flexible generation portfolio with a short position to the pool Average 6 monthly Queensland Pool Prices Price Volatility and Wind Generation in South Australia 14,000 900 120…
Increases in renewables to achieve a 2020 renewable energy target1 will extend the supply curve and limit increases in wholesale prices ... NEM Supply Bidstack - 2015 vs 20202 Impacts of Solar Generation on an High Solar Day Limited…
These trends will hollow out the load duration curve, lowering prices for baseload generation and increasing volatility and peak prices Origins Generation Flexibility Change in NEM Load Duration Curve Capacity Energy 9,000 40 As…
1. Improving Delivering growth in Natural Gas and LNG 14
Origin has recombined our Exploration & Production and LNG businesses to integrate all our activities along the gas value chain Beetaloo Basin Origins first shale play APLNG (Downstream) 2-3 ships for loading per week Browse &…
Origins reserves are almost entirely gas, exposed to export gas prices Origin Reserves Australian domestic gas prices PJe are moving towards export parity 7,000 14.00 6,000 12.00 2014 prices 10.00 unusually low due A/GJ…
Sustained production from Train 1 expected in Q2 FY2016 and from Train 2 approximately 6 months later APLNGs UPSTREAM PROJECT IS 93% COMPLETE APLNGs DOWNSTREAM PROJECT IS 89% COMPLETE 17
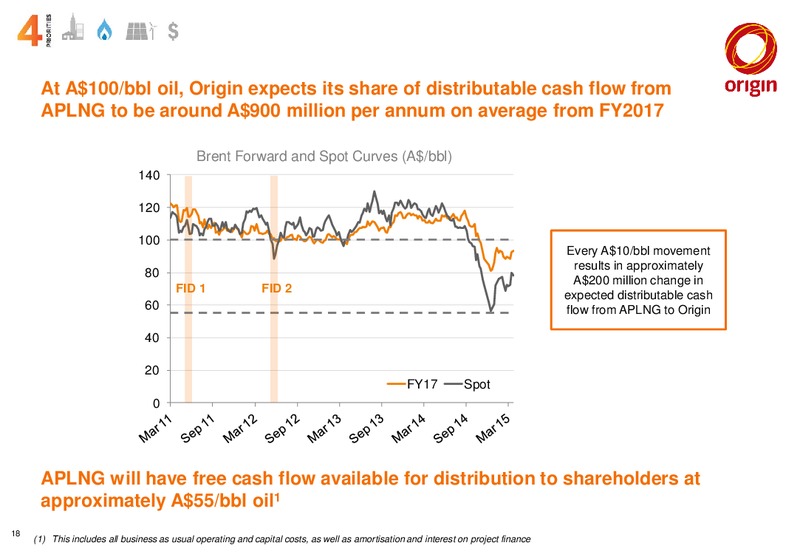
At A100/bbl oil, Origin expects its share of distributable cash flow from APLNG to be around A900 million per annum on average from FY2017 Brent Forward and Spot Curves (A/bbl) 140 120 100 Every A10/bbl movement results in…
Origin is prioritising capital spend on upstream projects with the highest returns and shortest payback periods BASS BASIN OTWAY BASIN PERTH BASIN Sapura 3000 heavy lift vessel with Compressor Ensign 931 rig Module suspended…
1. Improving Growing capabilities and increasing investment in renewables 20
Origin will continue to secure opportunities in utility scale renewables where it is economic to do so Cuervo Dam, Chile Sorik Marapi, Indonesia Javiera Solar Project Northern Chile Sorik Marapi, Indonesia 21
1. Improving Capital management and funding 22
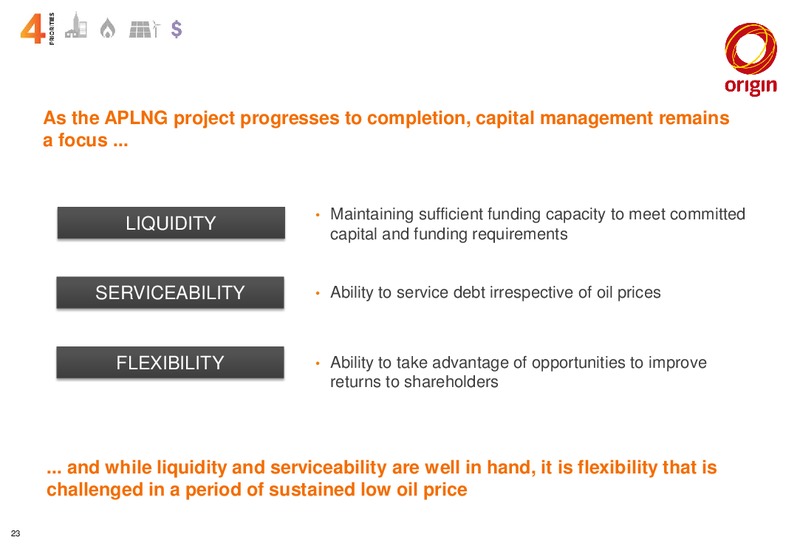
As the APLNG project progresses to completion, capital management remains a focus ... Maintaining sufficient funding capacity to meet committed LIQUIDITY capital and funding requirements SERVICEABILITY Ability to service debt…
Origin has more than sufficient liquidity to fund its expected remaining contributions to APLNG with maturities extending beyond FY2018 Origin Debt & Bank Guarantee Maturity Profile as at 31 December 20141 6,000 Loans & Bank…
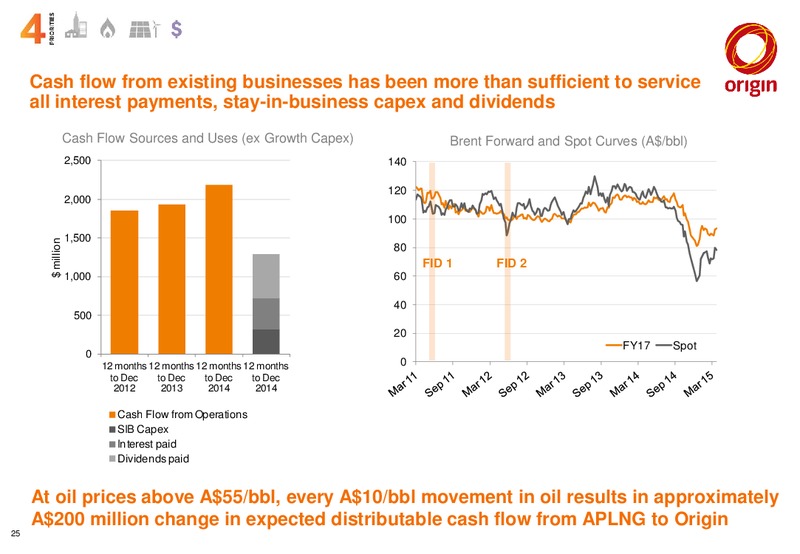
Cash flow from existing businesses has been more than sufficient to service all interest payments, stay-in-business capex and dividends Cash Flow Sources and Uses (ex Growth Capex) Brent Forward and Spot Curves (A/bbl) 2,500 140…
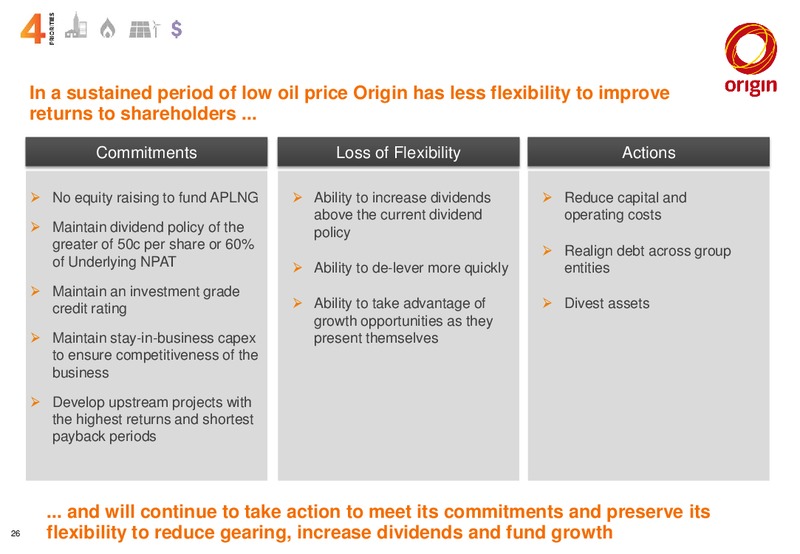
In a sustained period of low oil price Origin has less flexibility to improve returns to shareholders ... Commitments Loss of Flexibility Actions No equity raising to fund APLNG Ability to increase dividends Reduce capital and…
Origins strategy of connecting resources to markets is pursued through its 3 businesses, 4 priorities and 5 measures that drive continued improvement in Origins performance A regionally A growing A regional leader significant…
Natural Gas Unit Gross Profit up 15% (0.40/GJ) as tariffs increase in line with rising East Coast market prices while underlying energy procurement costs remain flat External Volumes Sold (PJ) HY2015 HY2014 Change Retail (Consumer…
Electricity Gross Profit up 13% (4.10/MWh) primarily due to higher retail tariffs and stable black energy procurement costs Volumes Sold (TWh) HY2015 HY2014 Change Retail (Consumer & SME) 9.1 9.1 (0.0) Business 9.6 10.4 (0.8)…
Origins integrated Energy Markets business continues to be Australias leading provider of energy products Upstream FuelFuel Generation Wholesale/Retail Retailer Generator Flexible and diverse fuel Flexible generation Leading…
Contact operates a similar integrated business model to Origin however Contacts primary fuels are renewables which are not subsidised by government regulation Upstream FuelFuel Generation Wholesale/Retail Retailer Generator…
APLNGs reserves base includes prime acreage in both known and industry accepted sweet spots in Queensland PJ 100% APLNG Reserves and Resources1 20,000 15,000 10,000 5,000 - Estimated Requirements APLNG tenure in the…
Typical Phase 1 Well Forecast Dewatering Stable Production Stage Decline Stage Typical phase 1 well forecast to Stage have: peak gas rate 1-2 TJ/d Production Rate peak water rate 500-1000 Gas bbl/d approx 50-70% of…
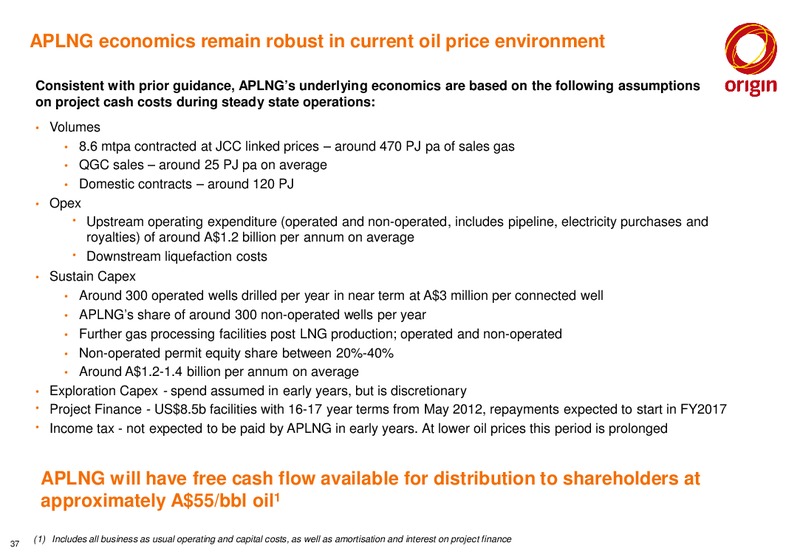
APLNG economics remain robust in current oil price environment Consistent with prior guidance, APLNGs underlying economics are based on the following assumptions on project cash costs during steady state operations: Volumes 8.6 mtpa…
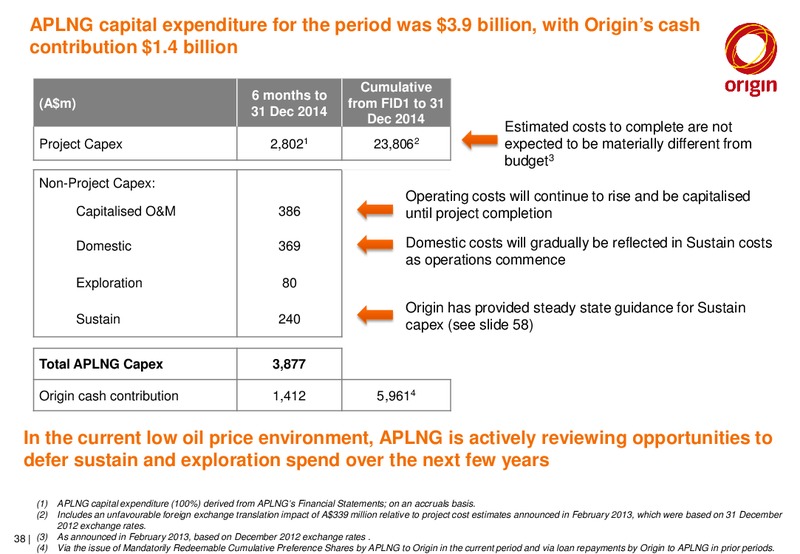
APLNG capital expenditure for the period was 3.9 billion, with Origins cash contribution 1.4 billion Cumulative 6 months to (Am) from FID1 to 31 31 Dec 2014 Dec 2014 Estimated costs to complete are not Project Capex 2,8021…
Origin will lower capex spend relative to prior plans, limiting investments to higher returning projects Growth Capital Expenditure by Segment and Origins Cash Contribution to APLNG1,2 5,000 E&P capex focused on increasing gas…
THANK YOU For more information Chau Le Group Manager, Investor Relations Email: chau.leoriginenergy.com.au Office: +61 2 9375 5816 Mobile: + 61 467 799 642 www.originenergy.com.au 41
 Loading...