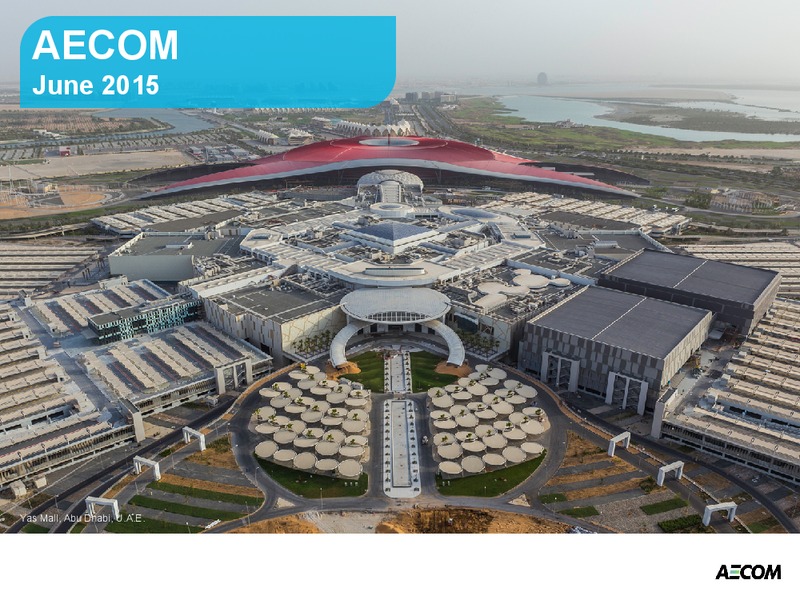
A Leading Global Engineering and Construction Services Company Vision: Become the worlds leading fully integrated infrastructure firm. Leading provider of infrastructure services with skillsets enhanced through the URS…
Q2 FY15 Operational Achievements Delivered on cash and debt reduction: In 1H FY15, generated 277 million of free cash flow1 and reduced debt by more than 450 million2. Returned to positive organic growth: Delivered 10% organic…
Integration Update We are executing against our plan to deliver synergies, leverage growth opportunities, and reduce our debt. 275-million total synergy target on track. - Exited second quarter at a 70-million run rate. - Completed…
Cash Generation and Capital Allocation Highlights 1H FY15 Highlights Closed financing of URS transaction. Generated 277 million of Free Cash Flow1. Repaid more than 450 million in debt subsequent to closing the URS transaction in…
Positioned for Domestic Infrastructure Growth AECOM holds the leading position in several market categories. An estimated 3.6 trillion1 is needed to maintain domestic infrastructure. Congress working towards a funding solution to…
Design and Consulting Services (45% of Revenue) 1 ranked design firm and 1 designer in international markets1. DCS DCS 34% 35%ofof Backlog Backlog DBFO Strengthened competitive position in the Americas. Concentrated in regions…
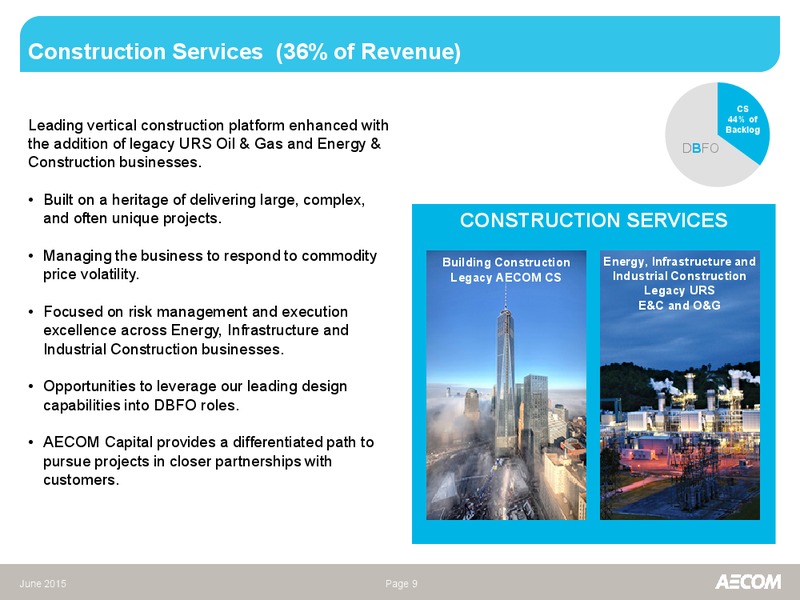
Construction Services (36% of Revenue) CS CS 44% 40%of Leading vertical construction platform enhanced with of Backlog Backlog the addition of legacy URS Oil & Gas and Energy & DBFO Construction businesses. Built on a…
Management Services (19% of Revenue) MS MS 22% of 25% of Backlog Backlog Management Services (MS) extends AECOMs integrated model beyond design and construction through life-cycle management DBFO and support for government and…
Q2 FY15 Business Highlights & Outlook Design & Consulting Services Construction Services Management Services Returned to positive organic Building construction outlook Leveraging cyber, intelligence, growth. remains strong. and O&M…
Fiscal 2015 Outlook Adjusted EPS1 of 3.15 to 3.55. On track with our operating outlook. Guidance includes 0.30 net impact of acquisition-related accounting items. Other metrics Effective adjusted tax rate2 of approximately 30%.…
Executing Our Strategy Diversified Platform Funding Sources Non-U.S. Government 13% Private U.S. 14% State/Local End Markets 49% Geographies Federal/ Support Services Canada Facilities/ 24% Industrial Asia-Pacific 9% 19%…
Appendix: Reconciliation for Amortization, Acquisition & Integration Expenses June 2015 Page 14
Appendix: Reconciliation for Amortization, Acquisition & Integration Expenses June 2015 Page 15
Thank you 100K Employees Nearly 100,000 dedicated professionals globally 19 Billion 19 billion in pro-forma revenue 150+ Countries for LTM ended March 31, 2015 Serving clients in over 150 countries around the…
 Loading...