EARNINGS PRESENTATION FOURTH QUARTER & FULL YEAR ENDED NOVEMBER 30, 2009 FEBRUARY 17, 2010 3:00 PM UK TIME seabed-to-surface
Highlights Strong fourth quarter performance: Continuing operations: Revenue of 622 million Adjusted EBITDA of 163 million Adjusted EBITDA margin of 26.3% Net income of 79 million Diluted EPS of 0.39 Solid full year…
2009 positioned for profitable growth Delivered on our commitments: Outstanding execution of larger and more complex projects Financial discipline: Maintained a good project risk profile Managed our cost base without compromising…
Acergy Borealis post hull launch seabed-to-surface February 17, 2010 slide 5
Acergy Borealis final design Brief technical details: Overall length 182m Breadth 46m Main crane capacity 5,000Te DP3 dynamic positioning system Steep-S single joint pipelay system with 600Te capacity Double joint J-Lay system…
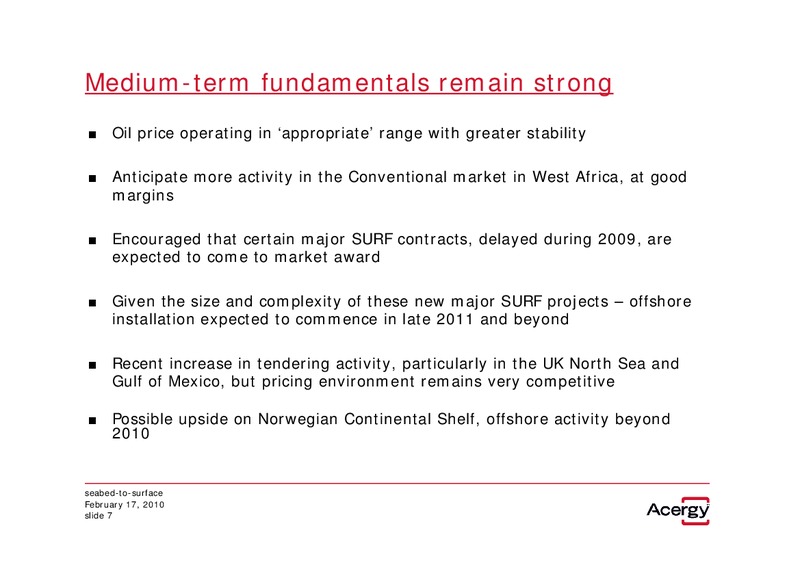
Medium-term fundamentals remain strong Oil price operating in appropriate range with greater stability Anticipate more activity in the Conventional market in West Africa, at good margins Encouraged that certain major SURF contracts,…
Building our future 1.7 billion of backlog in hand for execution in 2010; supports 2010 guidance Clear and focused strategy growth expected to be driven by global SURF market while Conventional market in West Africa remains strong…
Financial Highlights Three-Months Ended Nov.30, Nov.30, In millions, except share and per share data 2009 2008 Unaudited Unaudited Continuing operations: Revenue 621.9 567.9 Adjusted EBITDA(a) 163.3 135.1 Net operating income…
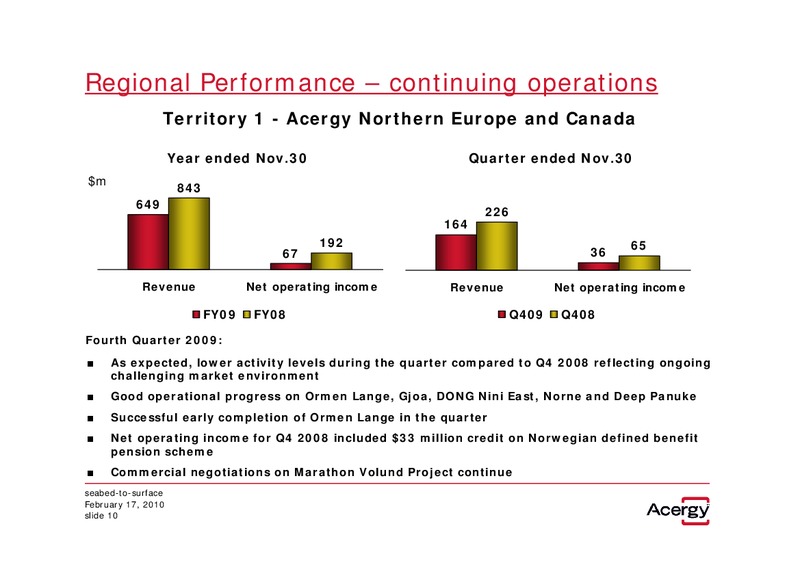
Regional Performance continuing operations Territory 1 - Acergy Northern Europe and Canada Year ended Nov.30 Quarter ended Nov.30 m 843 649 226 164 192 65 67 36 Revenue Net operating income Revenue Net operating income FY09…
Regional Performance continuing operations Territory 1 - Acergy Asia and Middle East Year ended Nov.30 Quarter ended Nov.30 m 62 206 181 45 38 14 10 2 Revenue Net operating income Revenue Net operating income FY09 FY08 Q409…
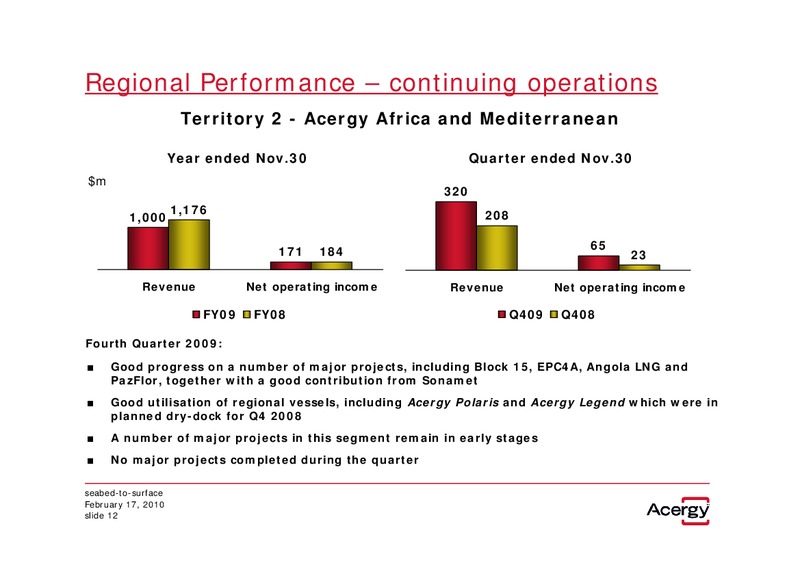
Regional Performance continuing operations Territory 2 - Acergy Africa and Mediterranean Year ended Nov.30 Quarter ended Nov.30 m 320 1,176 208 1,000 65 171 184 23 Revenue Net operating income Revenue Net operating income…
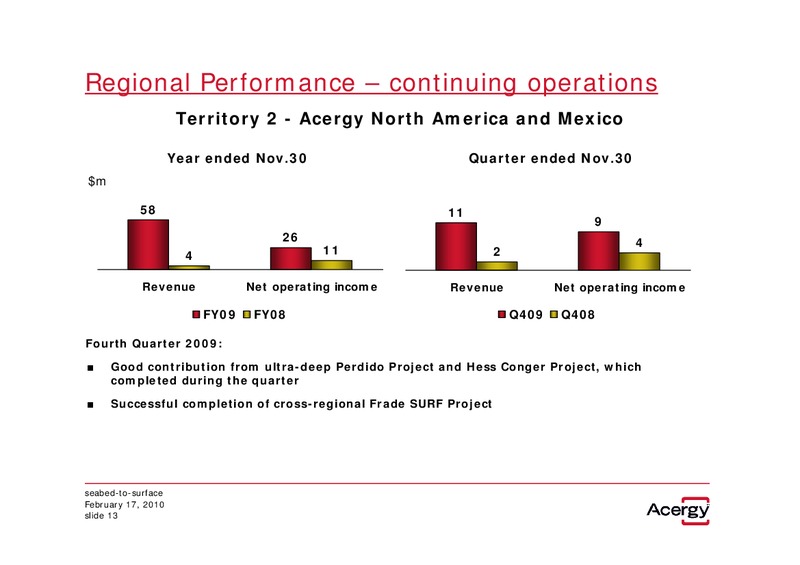
Regional Performance continuing operations Territory 2 - Acergy North America and Mexico Year ended Nov.30 Quarter ended Nov.30 m 58 11 9 26 4 4 11 2 Revenue Net operating income Revenue Net operating income FY09 FY08 Q409…
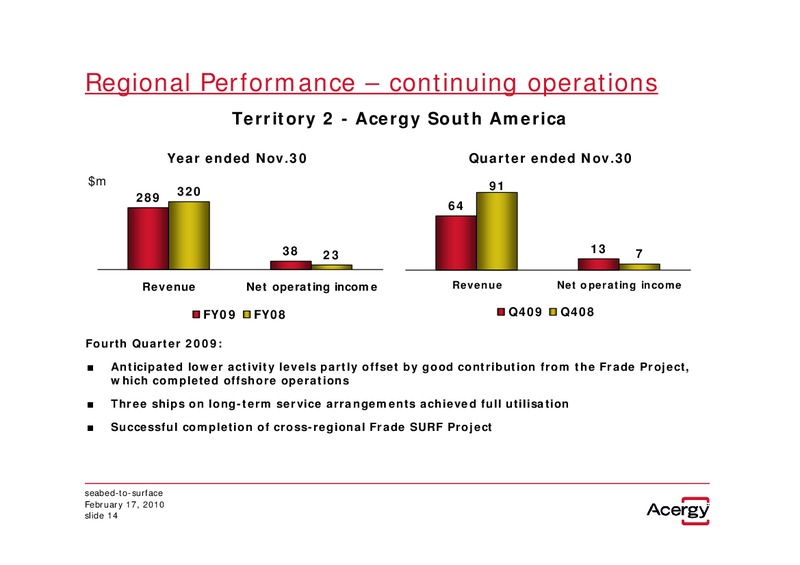
Regional Performance continuing operations Territory 2 - Acergy South America Year ended Nov.30 Quarter ended Nov.30 m 91 320 289 64 38 13 7 23 Revenue Net operating income Revenue Net operating income FY09 FY08 Q409 Q408…
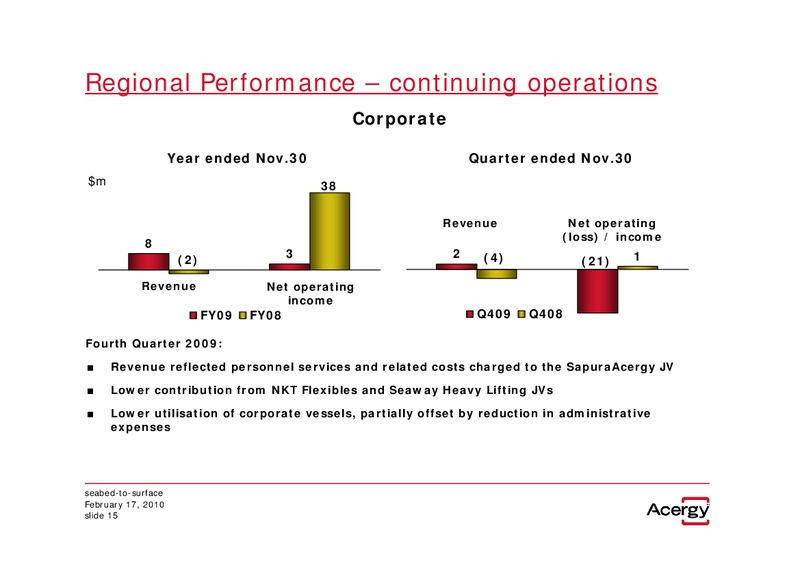
Regional Performance continuing operations Corporate Year ended Nov.30 Quarter ended Nov.30 m 38 Revenue Net operating (loss) / income 8 3 2 (4) 1 (2) (21) Revenue Net operating income FY09 FY08 Q409 Q408 Fourth Quarter…
Financial Highlights Twelve-Months Ended Nov.30, Nov.30, In millions, except share and per share data 2009 2008 Audited Audited Continuing operations: Revenue 2,208.8 2,522.4 Adjusted EBITDA(a) 488.3 573.0 Net operating income…
Cashflow Highlights In millions Three-Months Ended Twelve-Months Ended Nov.30, 2009 Nov.30, 2009 Net income total operations 81.1 265.7 Depreciation and amortisation 35.3 131.1 Impairment 15.6 15.6 Other non cash items from…
Balance Sheet Highlights In millions as at November November 30, 2009 30, 2008 Audited (1) Audited (1) Property, plant and equipment 821.8 907.6 Interest in associates and joint ventures 190.3 140.2 Trade and other receivables…
Appendices seabed-to-surface February 17, 2010 slide 19
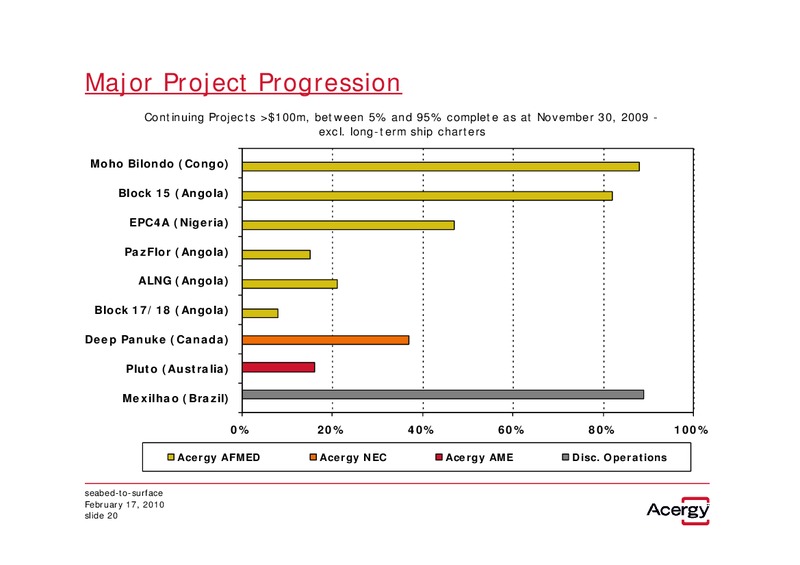
Major Project Progression Continuing Projects 100m, between 5% and 95% complete as at November 30, 2009 - excl. long-term ship charters Moho Bilondo (Congo) Block 15 (Angola) EPC4A (Nigeria) PazFlor (Angola) ALNG (Angola)…
Backlog Analysis continuing operations In millions as at: Nov.30.09 Aug.31.09 Nov.30.08 (1) Backlog 2,848 2,628 2,511 (2) Pre-Backlog 249 42 149 (1) Backlog excludes amounts related to discontinued operations as of Nov.30.09: 43…
Segmental Analysis continuing operations For the three months Acergy Acergy Acergy Acergy Acergy Acergy Total ended Nov.30.09 NEC AME AFMED NAMEX SAM Corporate continuing operations In millions Revenue 163.5 62.0 320.1 11.0 63.5…
Segmental Analysis continuing operations For the twelve months Acergy Acergy Acergy Acergy Acergy Acergy Total ended Nov.30.09 NEC AME AFMED NAMEX SAM Corporate continuing operations In millions Revenue 648.8 206.0 999.7 57.8 288.8…
Regional Performance discontinued operations Discontinued Operations Year ended Nov.30 Quarter ended Nov.30 m 282 105 115 30 16 (23) 5 4 Revenue Net operating Revenue Net operating income income/(loss) FY09 FY08 Q409 Q408…
Adjusted EBITDA (a) Adjusted EBITDA: The Group calculates Adjusted EBITDA from continuing operations (adjusted earnings before interest, income taxation, depreciation and amortisation) as net income from continuing operations plus…
Reconciliation of Net Income to Adjusted EBITDA Three-Months Ended Three-Months Ended November 30, 2009 November 30, 2008 Total Total In millions (except percentages) Continuing Discontinued Continuing Discontinued operations…
Reconciliation of Net Operating Income to Adjusted EBITDA Three-Months Ended Three-Months Ended November 30, 2009 November 30, 2008 Total Total In millions (except percentages) Continuing Discontinued Continuing Discontinued…
 Loading...