SeaBird Exploration Limited SBX Third Quarter 2009
Disclaimer All statements contained in this presentation that are not statements of historical facts, including statements on projected operating results, financial position, business strategy and other plans and objectives for future…
Highlights Q3 2009 A full scale test of 42 deep water Ocean Bottom Node (OBN) seismic completed mid July in about 2000 m water depth in GOM. Multi-client data from this survey sold to several major oil companies. SeaBird retains…
Post Q3 developments Several new 2D contracts awarded and all SeaBirds vessels employed on improved contract terms during October with added backlog of USD 40 million to a total of USD 145 million. Osprey Explorer is being mobilized…
Current Operational Positions End October 2009 Hawk Explorer Fugro TC (Nov 2009) Barents Sea Munin Explorer East Greenland, thereafter GOM Harrier Explorer PGS TC (Sep 2011) US GOM Osprey Explorer DD, then 4 months…
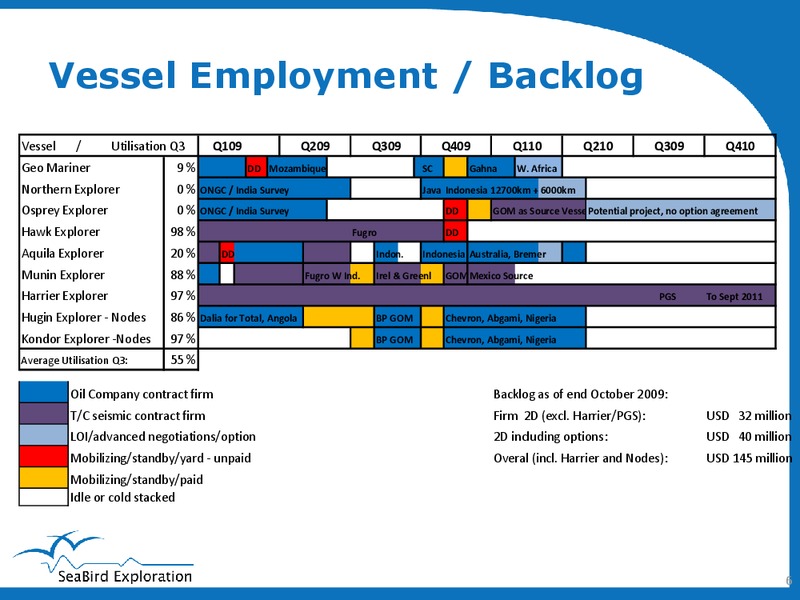
Vessel Employment / Backlog Vessel / Utilisation Q3 Q109 Q209 Q309 Q409 Q110 Q210 Q309 Q410 Geo Mariner 9% DD Mozambique SC Gahna W. Africa Northern Explorer 0 % ONGC / India Survey Java Indonesia 12700km + 6000km Osprey Explorer 0 %…
Market Outlook 2D 2D demand has been on a steady decline from Q4 2008 up until Q3 2009 Day rates down from USD 70-90 000 last year to +/- 50 000, now increasing SeaBird believe in a continued positive improvement from Q4 2009 Based…
Ocean Bottom Nodes update All major oil companies have expressed a strong need to monitor deep water field reservoirs over its life, where infrastructure on surface and congested seabed make alternative seismic solutions unattractive…
Financials Q3 2009 9
Consolidated Income Statement 3rd Quarter 2009 Quarter ended Nine months ended Year end 30 Sep 30 Sep 31 Dec All figures in USD 1,000 2009 2008 2009 2008 2008 Revenue 28 901 56 526 120 509 154 938 215 786 Charter hire and operating…
Sequential Development Revenues Utilization reduced from Q2: 80%, to Q3: 55% USD millions Utilization % 70 100 % Reduced revenue correspondingly from Q2 to Q3 60 80 % 50 While a major part of revenue first half 2009 40 60 % was…
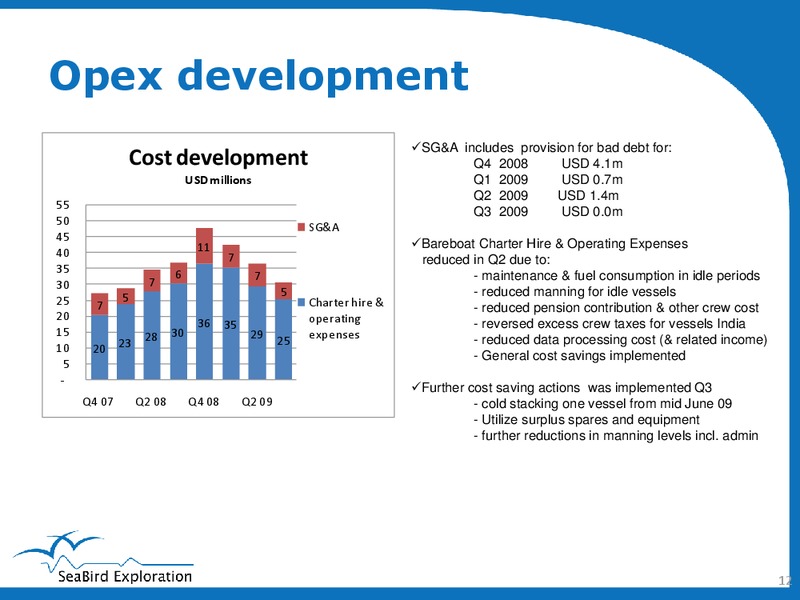
Opex development SG&A includes provision for bad debt for: Cost development Q4 2008 USD 4.1m USD millions Q1 2009 USD 0.7m Q2 2009 USD 1.4m 55 Q3 2009 USD 0.0m 50 SG&A 45 11 Bareboat Charter Hire & Operating Expenses 40 7 reduced…
Sequential Development EBITDA Improved EBITDA in Q2 caused USD millions by reduced operating expenses. 28 26 EBITDA level Q3 is a result of 24 22 low utilisation and 2d vessels in 20 18 idle or colds stacked mode. Major 16 14…
Consolidated Balance Sheet As of 30 Sep As of 31 Dec All figures in USD 1,000 2009 2008 Non-current Tangible assets 337 933 344 068 Non-current Intangible assets 27 054 24 800 Other current assets 39 812 57 617 Cash and Cash…
Consolidated Cash Flow Year ended Quarter ended 30 Sep Nine months ended 30 Sep ended 31 Dec All figures in USD 1,000 2009 2008 2009 2008 2008 Net cash from operating activities 3 786 9 114 18 862 49 669 57 642 Capital Expenditures…
Maturity of borrowings 90 80 18 70 60 50 Various bank loans 40 Bond loans 63 Financial lease 30 14 20 30 - 10 12 13 1 - - 3- 3- 3 3 Q309 Q409 2010 2011 2012 Thereafter 16
Outlook 17
Outlook Potential for Ocean Bottom Node (OBN) seismic looks very promising with several major oil companies considering SeaBird's OBN technology as a preferred solution A second OBN operation is under consideration Fleet utilisation…
For further questions contact CEO Tim Isden E-mail: tim.isdensbexp.com Ph. (971) 504 539075 or CFO Kai Solberg-Hansen E-mail: kai.solberg-hansensbexp.com Ph.(47)920 51455 19 19
 Loading...