C l Di I Cal Dive International i l 4th Quarter 2010 Earnings Conference Call
Presentation Outline Presentation Outline Summary of 4Q 2010 Results Backlog Discussion of Financial Results Non-GAAP Reconciliations Questions & Answers 3
Summary of 4Q Results Higher utilization levels compared to 4Q 09 but fewer large construction projects. Solid backlog at end of 2010. No outstanding borrowings under revolver at year-end. year-end Debt to EBITDA at 2x. 2x…
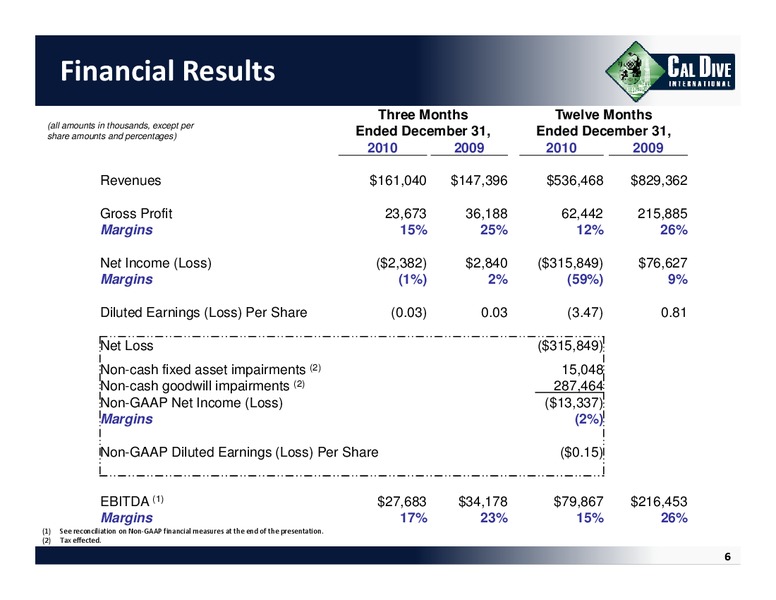
Financial Results Three Th Months M th Twelve T l Months M th (all amounts in thousands, except per share amounts and percentages) Ended December 31, Ended December 31, 2010 2009 2010 2009 Revenues 161,040 , 147,396 ,…
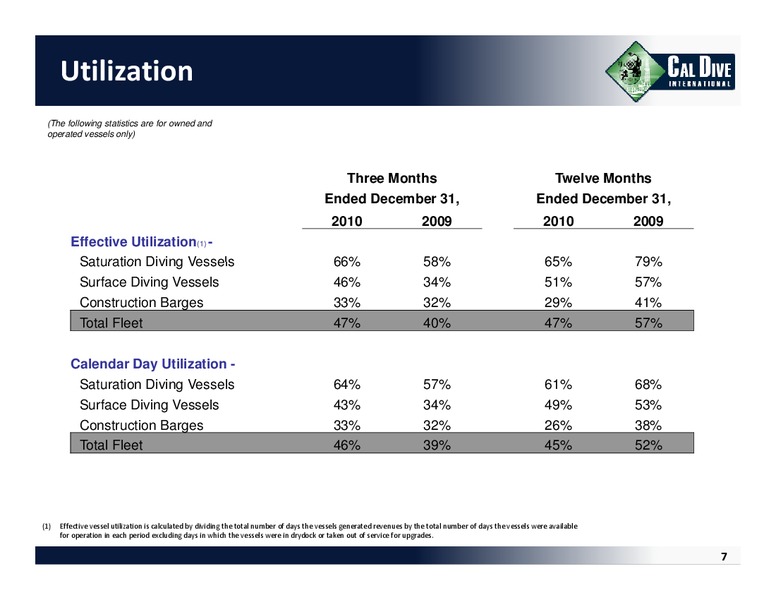
Utilization (The following statistics are for owned and operated vessels only) Three Months Twelve Months Ended December 31, Ended December 31, 2010 2009 2010 2009 Effective Utilization(1) - Saturation Diving Vessels 66% 58%…
Debt Levels Net Debt Levels (1) Net Debt to Book Cap. % (2) ( millions) Horizon Acquisition (1) Calculated as Total Debt less Cash and Cash Equivalents. (2) Calculated as Net Debt divided by Stockholders Equity plus Net Debt. 9
Liquidity Liquidity Position ( millions) 354 348 349 295 242 243 (1) (2) (1) Pro forma impact of amendment to credit facility. (2) Unborrowed revolver borrowing capacity calculated based on max allowed Debt to EBITDA ratio…
NonGAAP Reconciliations ili i 11
EBITDA Reconciliations In addition to net income, one primary measure that we use to evaluate our financial performance is earnings before net interest expense, taxes, depreciation and amortization, or EBITDA. We use EBITDA to measure…
 Loading...