SeaBird Exploration PLC SBX Third Quarter 2011 30th November 2011 0800 CET Continental Hotel Oslo
Disclaimer All statements contained in this presentation that are not statements of historical facts, including statements on projected operating results, financial position, business strategy and other plans and objectives for future…
Highlights Q3 2011 & Update Ocean Bottom Node (OBN) contract with ONGC in India awarded on 23 August 2011. Following an application from SeaBird, bondholders of the NOK 81.75 million (net NOK 78.75 million) bond approved in a…
Q3 OBN vessel developments & update Utilization in Q3-11 for the two vessels was 98%. Hugin Explorer and Munin Explorer completed the Chevron Rosebank survey on 16 August 2011 with an acquisition QC success rate of 99% utilising a…
Q3 vessel developments & update 2D/3D Operating fleet utilisation for the 2D/3D vessels was 69% in Q3-11 after allowing for yard/idle time. (This excludes the Voyager Explorer which was rigged during Q3-11 and commenced operations in…
Outlook and going forward 2012 The general market in source and 2D contracts has still remained static during 2011. SeaBird has maintained a good contract utilisation for its fleet, taking multi client contracts only where economically…
Multiclient by SeaBird SeaBird participates with Multiclient Providers where all or part of the Multiclient sales come later SeaBird is not pursuing Multiclient activity, but participates if ordinary 2D direct client seismic work is…
Financials Q3 2011 8
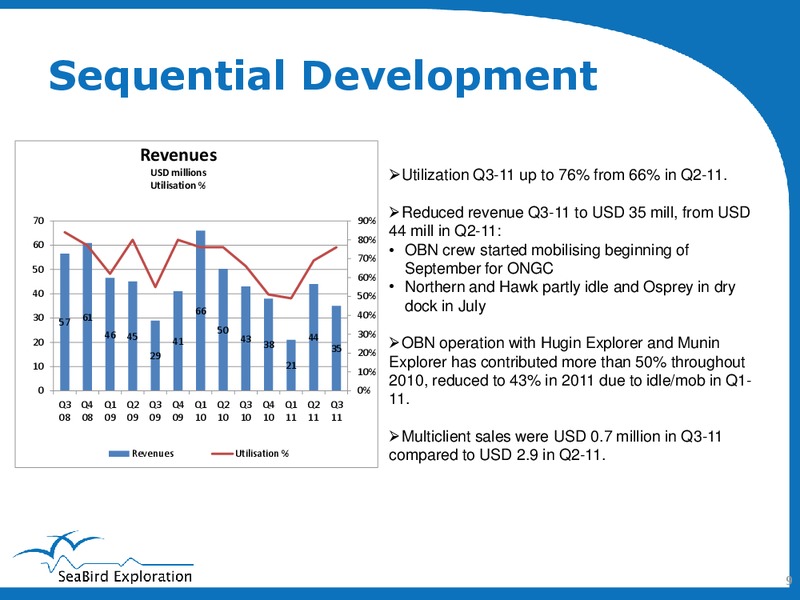
Sequential Development Revenues USD millions Utilization Q3-11 up to 76% from 66% in Q2-11. Utilisation % 70 90% Reduced revenue Q3-11 to USD 35 mill, from USD 80% 44 mill in Q2-11: 60 70% OBN crew started mobilising beginning…
Opex Development SG&A (sales, general admin) includes Cost development provision for bad debt for: USD millions 55.0 Q1 2009 USD 0.7mill 50.0 Q2 2009 USD 1.4mill 45.0 Q4 2010 USD 2.0mill 5.8 40.0 11.4 7.1 5.9 8.2 Q3 2011 USD 0.5mill…
Sequential Development Q3-11 reduced EBITDA mainly due to lower EBITDA revenues and higher SG&A costs. USD millions 25.0 Q2-11 improved EBITDA as OBN operation 20.8 resumed 20 April after mobilisation and idle mode 19.8 20.0 since…
Consolidated Income Statement 3rd Quarter 2011 Quarter ended Nine months ended Year ended 30 Sept 30 Sept 31 Dec All figures in USD 1,000 2011 2010 2011 2010 2010 (Unaudited) (Unaudited) (Unaudited) (Unaudited) (Audited) Revenues…
Consolidated Balance Sheet As of 30 Sept As of 31 Dec All figures in USD 1,000 2011 2010 2010 (Unaudited) (Unaudited) (Audited) Non-current Tangible assets 209,580 319,165 283,622 Non-current Intangible assets 21,350 26,671 26,568 Other…
Consolidated Cash Flow Nine months ended 30 Year ended Quarter ended 30 Sept Sept 31 Dec All figures in USD 1,000 2011 2010 2011 2010 2010 Net cash from operating activities 18,640 (347) (15,610) 16,492 5,224 Capital expenditures…
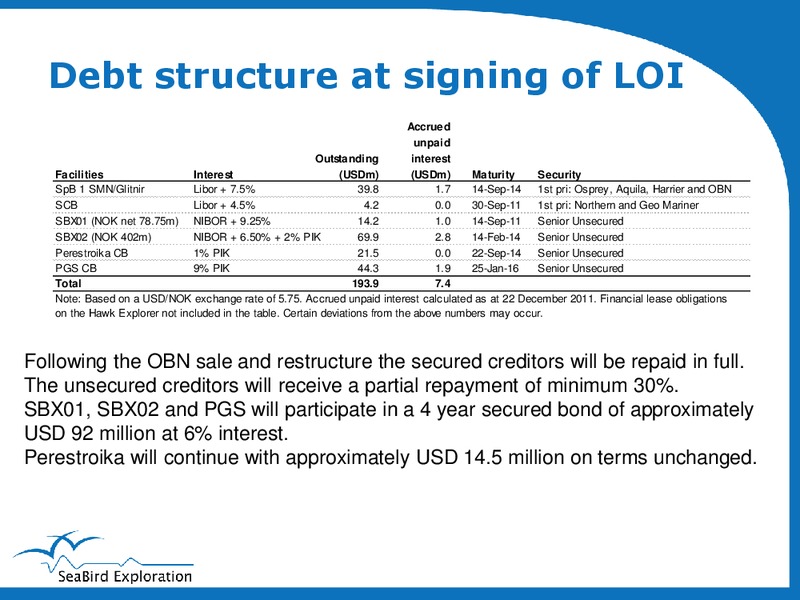
Debt structure at signing of LOI Accrued unpaid Outstanding interest Facilities Interest (USDm) (USDm) Maturity Security SpB 1 SMN/Glitnir Libor + 7.5% 39.8 1.7 14-Sep-14 1st pri: Osprey, Aquila, Harrier and OBN SCB Libor + 4.5%…
For further questions contact CEO Tim Isden E-mail: tim.isdensbexp.com Ph. +97150 453 9075 16 16
 Loading...