Forward-looking statements All statements contained in this presentation that are not statements of historical facts, including statements on projected operating results, financial position, business strategy and other plans and…
Highlights First quarter showed signs of improving customer demand although still a challenging market environment The company entered into or extended contracts representing an estimated value of approximately USD 30 million Hugin…
Highlights - continued Continued effort focused on cost restructuring Meaningful run-rate cost reduction achieved to date Will continue to explore alternatives to further improve the cost structure Significant management changes at…
Financial summary
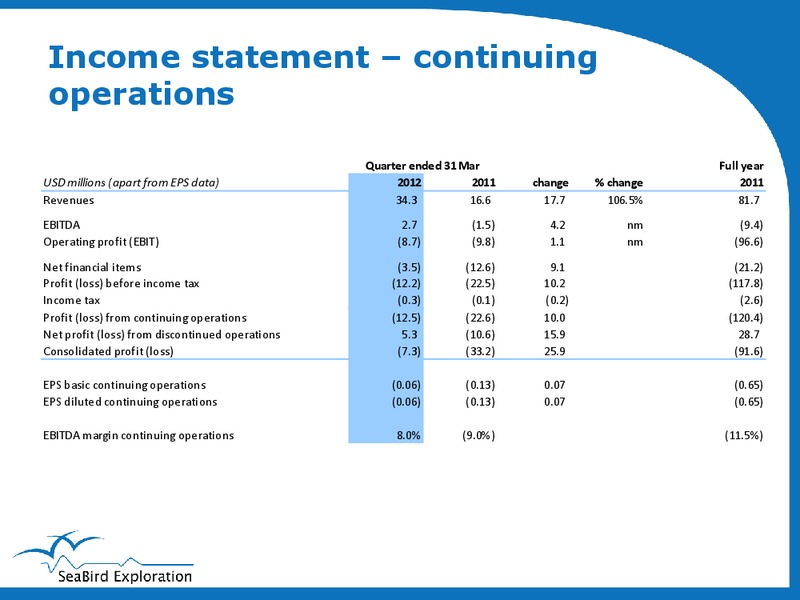
Income statement continuing operations Quarter ended 31 Mar Full year USD millions (apart from EPS data) 2012 2011 change % change 2011 Revenues 34.3 16.6 17.7 106.5% 81.7 EBITDA 2.7 (1.5) 4.2 nm (9.4) Operating profit (EBIT) (8.7)…
Cash flow statement Quarter ended 31 Mar Full year USD millions 2012 2011 2011 Net cash from operating activities 2.5 (36.1) (64.6) Capital expenditures (1.3) (0.3) (12.0) Net cash from other investing activities - - 121.4 Borrowings…
Balance sheet As of 31 Mar As of 31 Dec USD millions 2011 2010 2011 Non-current Tangible assets 146.0 276.8 153.6 Non-current Intangible assets 1.3 27.4 1.3 Other current assets 36.5 35.4 51.1 Cash and Cash Equivalents 13.7 11.4 13.3…
Business overview
Fleet update Vessel Ownership Vessel type Voyager Explorer Charter Seismic vessel Hawk Explorer Charter Seismic vessel Munin Explorer Charter Seismic vessel Kondor Explorer Charter Source vessel GGS Atlantic Charter Seismic vessel Aquila…
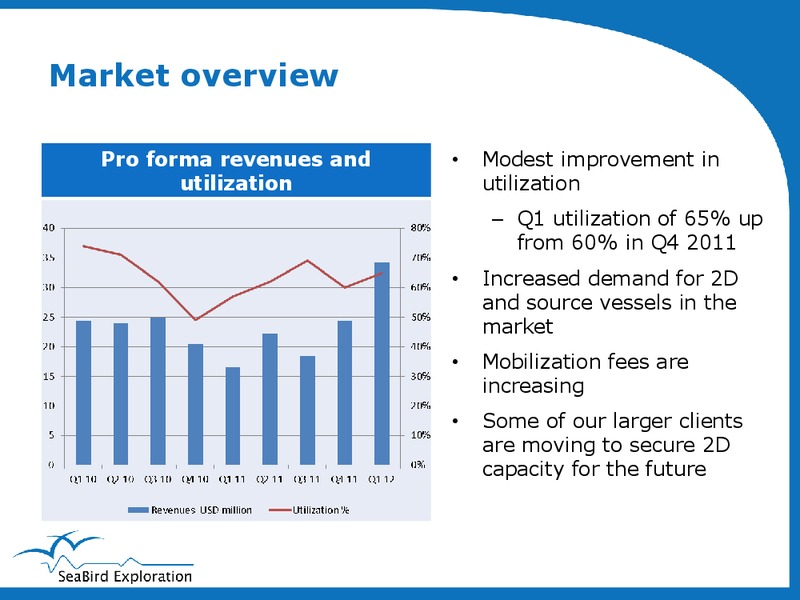
Market overview Pro forma revenues and Modest improvement in utilization utilization Q1 utilization of 65% up from 60% in Q4 2011 Increased demand for 2D and source vessels in the market Mobilization fees are increasing Some of…
Multi-client sector considerations Multi-client library Multi-client surveys is a part of the business strategy Q1 2012 figures USD Increased activity in the million sector over recent weeks Beginning balance Q1 2012 16.6 We…
Outlook An increasing number of vessel requests indicates continued market improvement However, visibility is still poor We are actively looking for more vessel capacity, but without significant long-term liabilities The goal is to…
 Loading...