FOURTH QUARTER 2014 RESULTS February 12, 2015 Oslo, Norway 1
Strong 2014 MultiClient Late Sales Well Placed to Navigate Current Market Environment Financial performance: EBITDA of USD 702.6 million Late sales of USD 309.0 million close to record high Marine contract EBIT margin of 15%…
Q4 2014 Highlights Record Late Sales Financial performance: Solid quarterly revenues of USD 430.1 million Record quarterly MultiClient late sales of USD 120.0 million Breakeven marine contract EBIT margin Quarter impacted by…
Order Book 800 700 600 Order book of USD 410 million by end Q4 2014 500 USD million Vessel booking* 400 80% booked for Q1 2015 55% booked for Q2 2015 300 30% booked for Q3 2015 20% booked for Q4 2015 200…
Financials Unaudited Fourth Quarter and Preliminary Full Year 2014 Results
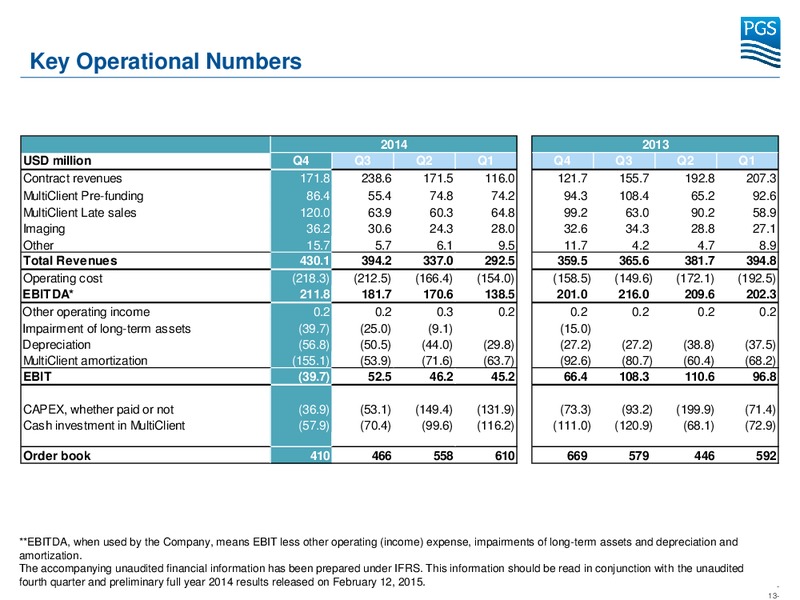
Condensed Consolidated Statement of Operations Summary Q4 Q4 Full year Full year USD million (except per share data) 2014 2013 % change 2014 2013 % change Revenues 430.1 359.5 20 % 1 453.8 1 501.6 -3 % EBITDA* 211.8 201.0 5%…
Impairment Charge and Increased MultiClient Amortization Impairment charge of USD 39.7 million in Q4 2014 (full year USD 73.8 million) relates to older and less productive vessels and equipment, and were triggered by vessel…
Stronger USD Negatively Impacts Q4 2014 Net Financial Items and Tax Q4 financial expenses include a foreign currency loss of USD 6.0 million (full year USD 13.4 million) Strengthening of the USD which negatively impacts the Companys…
MultiClient Revenues per Region Pre-funding and Late Sales Revenues Combined 250 Strong MultiClient sales performance in Q4 2014 200 Pre-funding revenues were 150 highest in North America and USD million Asia Pacific…
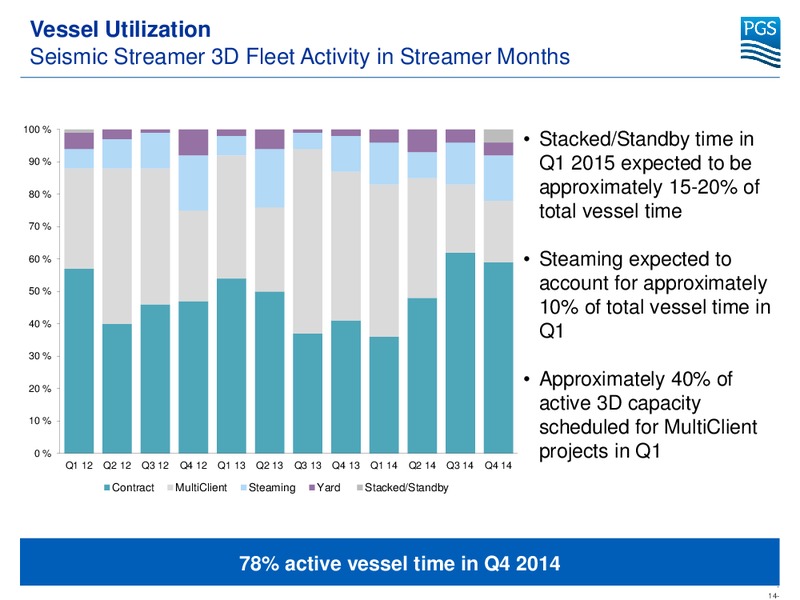
Vessel Utilization Seismic Streamer 3D Fleet Activity in Streamer Months 100 % Stacked/Standby time in 90 % Q1 2015 expected to be 80 % approximately 15-20% of total vessel time 70 % 60 % Steaming expected to 50 % account for…
Group Cost* Focus Delivers Results Cost starting to come down as 300 283 277 earlier guided 272 268 271 270 270 265 266 252 Positive impact from retirement 250 240 241 of Pacific Explorer and Nordic Explorer and reduced fuel…
Consolidated Statements of Cash Flows Summary Q4 Q4 Full year Full year USD million 2014 2013 2014 2013 Cash provided by operating activities 131.3 211.9 584.3 775.3 Investment in MultiClient library (57.9) (111.0) (344.2) (373.0)…
Balance Sheet Position - Key Numbers December 31 December 31 USD million 2014 2013 Total assets 3 563.0 3 544.3 MultiClient Library 695.2 576.9 Shareholders' equity 1 909.7 2 065.6 Cash and cash equiv. 54.7 263.8 Restricted cash…
Attractive Debt Structure No Maturities Before 2018 Long term Credit Lines and Interest Nominal Total Financial Covenants Bearing Debt Amount as Credit Line of end December 31, 2014 USD 400.0 million Term Loan (TLB), Libor USD 397.0…
Operational Update and Market Comments Unaudited Fourth Quarter and Preliminary Full Year 2014 Results
Current Market Characteristics Sharp oil price decline last six months Cautious spending pattern among oil companies impacts seismic bidding, pricing and utilization negatively Low visibility in all regions Further capacity…
Low Marine Contract Bidding Activity 3 500 3 000 Increased delays in conversion 2 500 of Sales Leads into Active Tenders USD million 2 000 Low bidding activity impacts 1 500 pricing and utilization negatively 1…
Global Supply and Demand Trends 600 Growth in sq.km. flattened out from 2012 to 2013 Total 3D volume in '000 sq.km. 500 400 300 In 2014 sq.km acquired declined 11% compared to 2013 200 100 15-20% decline in sq.km…
Strategy for Taking the Lead Lessons Learned from Previous Downturns Conservative financial gearing creates cyclical robustness Long term financing in place Preserving dividend capacity MultiClient reduces earnings volatility…
Good MultiClient Sales Performance from All Vintages 1 000 Strong sales progress for all 900 vintages 800 Moderate net book values (NBV) 700 for surveys completed 2010- 2014 600 USD million Work In Progress (WIP) 500…
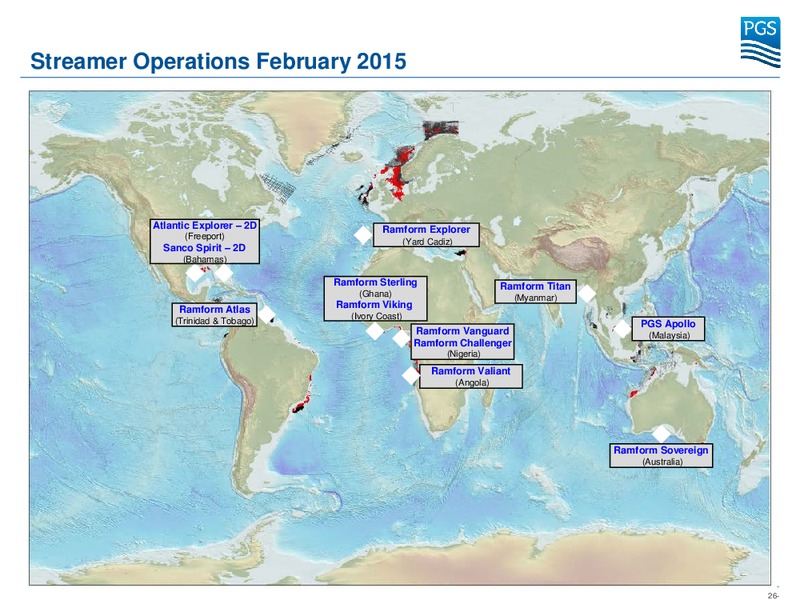
Streamer Operations February 2015 Atlantic Explorer 2D Ramform Explorer (Freeport) (Yard Cadiz) Sanco Spirit 2D (Bahamas) Ramform Sterling Ramform Titan (Ghana) (Myanmar) Ramform Atlas Ramform Viking (Ivory Coast) (Trinidad…
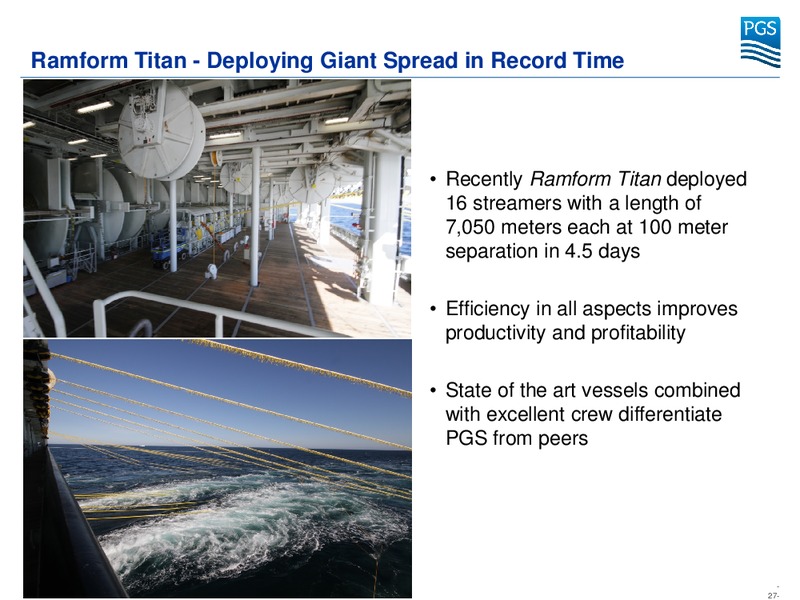
Ramform Titan - Deploying Giant Spread in Record Time Recently Ramform Titan deployed 16 streamers with a length of 7,050 meters each at 100 meter separation in 4.5 days Efficiency in all aspects improves productivity and…
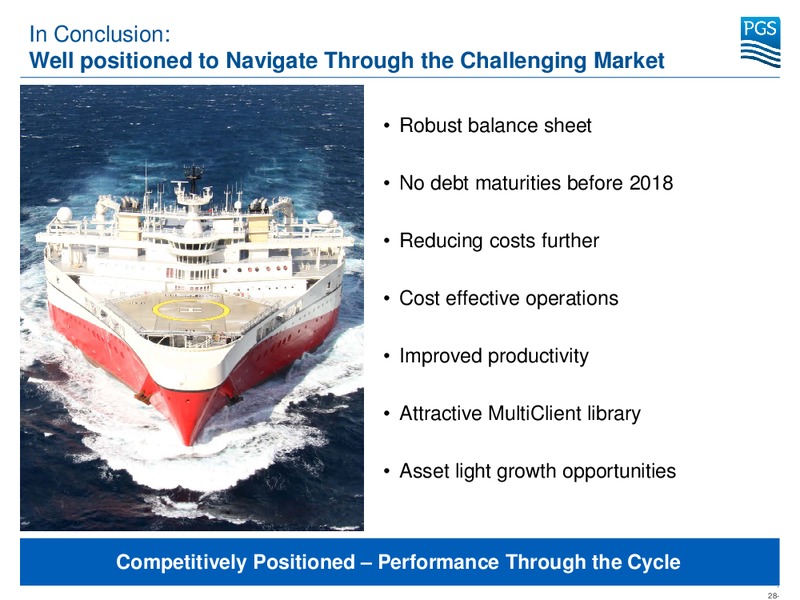
In Conclusion: Well positioned to Navigate Through the Challenging Market Robust balance sheet No debt maturities before 2018 Reducing costs further Cost effective operations Improved productivity Attractive MultiClient…
2015 Guidance EBITDA in the range of USD 550-700 million MultiClient cash investments of approximately USD 275-300 million Pre-funding level at or above 100% Capital expenditures of approximately USD 250 million Of which new…
Thank you Questions
Appendix PGS Seismic Fleet End 2014 Ramforms Conventional Delivery 2016 Titan class Ramform Titan Ramform Atlas Ramform Hyperion PGS Apollo Ramform Tethys S class Ramform Sterling Ramform Sovereign 2D/EM/Source V class…
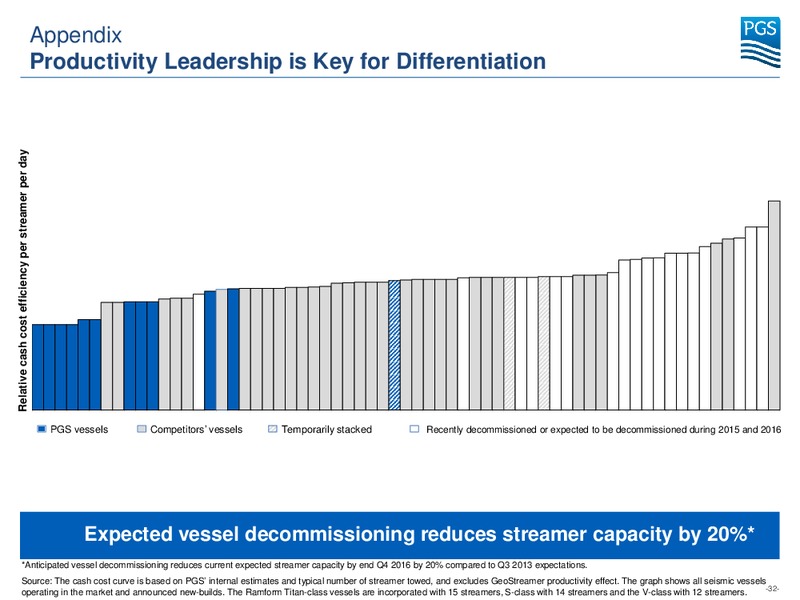
Appendix Productivity Leadership is Key for Differentiation Relative cash cost efficiency per streamer per day PGS vessels Competitors vessels Temporarily stacked Recently decommissioned or expected to be decommissioned during 2015…
Appendix Rescheduled Delivery Times for New Builds Delivery times for Ramform Tethys and Ramform Hyperion rescheduled to Q1 and Q3 2016 Reduces 2015 CAPEX by at least USD 160 million compared to previous baseline No cost…
Appendix Two Last New Builds are Fully Financed Timing of Instalments 200 Available undrawn ECF financing of USD 267 million corresponds 100 Paid NB to remaining yard instalments CAPEX by end 2014 Remaining Cash flow and secured…
Appendix Capital Expenditures 2015 Trends and Projections 500 Full year 2014 CAPEX expected to be 450 approximately USD 375 million Of which approximately USD 210 400 million relates to new builds 350 2015 CAPEX plan of…
Main Yard Stays Next 12 Months Vessel When Expected Type of Yard Stay Duration Ramform January 2015 During Warm Renewal class Explorer Stack Period Sanco Spirit June 2015 Approximately Renewal class 10 days (Owners Cost)…
 Loading...