Skip to main content COMPANY OVERVIEW – Crescent Point Energy Corp. Investor Presentation | Shale Experts
Loading...

COMPANY OVERVIEW – Crescent Point Energy Corp.

Crescent Point Energy Corp. · Sep 4, 2014 · 9 slides

Investor presentation from the Shale Experts oil & gas presentation and slide database. Every page is imaged and its text indexed for search across operators, plays, basins and time.

Slides

  1. COMPANY OVERVIEW – Crescent Point Energy Corp. – slide 1
    SASKATCHEWAN & MANITOBA CONSOLIDATION ACQUISITION, INCREASED 2014 CAPITAL EXPENDITURES, AND UPWARDLY REVISED GUIDANCE September 4, 2014
  2. COMPANY OVERVIEW – Crescent Point Energy Corp. – slide 2
    TSX: CPG NYSE: CPG 2014 Exit Production: 155,000 boe/d (90% oil weighted)(1) 2014 Funds Flow: 6.13/share(2)(3) Netback: 59.00/boe(2)(4) Yield: 6.2%(5) Annual Dividend: 2.76/share Payout Ratio: 45%(2) Market Capitalization:…
  3. COMPANY OVERVIEW – Crescent Point Energy Corp. – slide 3
    SOUTHEAST SASKATCHEWAN AND MANITOBA CONSOLIDATION ACQUISITION FROM LIGHTSTREAM RESOURCES Purchase price of 378 million Current production of 3,300 boe/d (95% light oil and liquids) 76 net sections of land 42 net sections…
  4. COMPANY OVERVIEW – Crescent Point Energy Corp. – slide 4
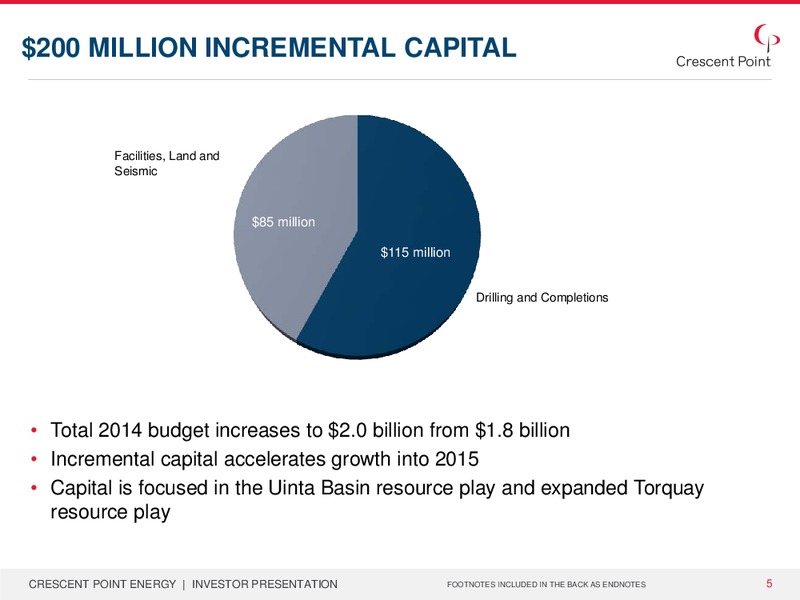
    200 MILLION INCREMENTAL CAPITAL Facilities, Land and Seismic 85 million 115 million Drilling and Completions Total 2014 budget increases to 2.0 billion from 1.8 billion Incremental capital accelerates growth into 2015…
  5. COMPANY OVERVIEW – Crescent Point Energy Corp. – slide 5
    INCREASED CAPITAL BUDGETS FOR TORQUAY PLAY AND UINTA BASIN DRIVE LONG-TERM GROWTH TORQUAY RESOURCE PLAY Original 2014 Revised 2014 Change budget budget Total Capital (million)(1) 200 314 114 Net Wells(2) 48 57 9 Notes: 1. 114…
  6. COMPANY OVERVIEW – Crescent Point Energy Corp. – slide 6
    UPWARDLY REVISED 2014 GUIDANCE Exit production increased to 155,000 boe/d from 149,000 boe/d Average daily production increased to 140,000 boe/d from 138,000 boe/d Funds flow from operations increased to 2.6 billion from 2.5…
  7. COMPANY OVERVIEW – Crescent Point Energy Corp. – slide 7
    HIGH-QUALITY ASSETS 3-year average reserves per share growth + dividend yield = 13%(1) Historical P+P Reserves (Mmboe)(3) Positive Reserve Revisions(4) (Mmboe) 100 800 80 600 Cumulative to year-end 2013 = 415.6 Mmboe 60…
  8. COMPANY OVERVIEW – Crescent Point Energy Corp. – slide 8
    PROVEN TRACK RECORD 3-year average production per share growth + dividend yield = 13%(1) Forecast 2014 exit of 155,000 boe/d(2) Corporate netback of 59.00/boe(3) 90% oil weighted(2) 160,000 Production Growth (boe/d) 10,000…
  9. COMPANY OVERVIEW – Crescent Point Energy Corp. – slide 9
    BUILDING CASH FLOW STRENGTH 3-year average funds flow per share growth + dividend yield = 20%(1) 2014 Guidance Funds flow of 2.6 billion Funds flow per share of 6.13, up 17% from original 2014 guidance of 5.24 18% Royalties Net debt…

From the store

Browse maps, data & reports in the Shale Experts store