Mobility of shale liquids and, thus, revenue flow are also strongly a function of reservoir pressure. The reservoir pressure we see in the Eagle Ford today is the result of how the pressure was created and how it was preserved after…
Finding Sweet Spots in Shale Liquids and Gas Plays Harris Cander H. Cander 2013 1
What is this talk about Identify sweet spots with very little data Sweet spot = Highest IRR Greatest mobility of most valuable fluid Mobility of fluids in tight rock Fluid viscosity Reservoir pressure H. Cander 2013 2
Petroleum & GOR Petroleum is a mixture of gas and oil Gas C1 C5 Oil C6+ Gas-Oil Ratio (GOR) Ratio of C1-C5 to C6+ scf/bbl H. Cander 2013 3
GOR: Gas Oil Ratio scf/bbl High viscosity Oil < 200 Black oil 200 - 1000 Volatile oil 1000 - 3200 Wet Gas / Condensate 3200 15,000 Wet Gas 15,000 70,000 Dry Gas 70,000 H. Cander 2013 4
Phase Liquid < 3200 GOR Vapor 3200 GOR Liquid can contain a lot of C1-5 Vapor can contain a lot of C6+ H. Cander 2013 5
What are unconventionals Cander, H., 2012, AAPG Search and Discovery 80217 H. Cander 2013 42
Eagle Ford Fluid Fairways Sweet spot H. Cander 2013 6
Eagle Ford liquids sweet spot Intersection of GOR and High Pressure Reservoir Pressure psi H. Cander 2013 7
Liquids Sweet Spot Least viscous liquid phase at highest pressure Most liquids-rich vapor phase at highest pressure Predicted GOR scf/bbl With 10,000 psi line H. Cander 2013 8
Unconventional but still obey principles k * H *DP Q = m Q = well flow rate k = permeability H = thickness DP = Reservoir Pressure wellbore pressure m= viscosity P and mchange a lot in a typical shale fairway H. Cander…
Maturity vs. GOR & Viscosity 00000 10000 1000 100 10 1 0.1 0.01 100 120 140 160 180 200 Temperature C H. Cander 2013 10
Eagle Ford Gas Rate Influence of viscosity even in gas 100,000 GOR 10,000 scf/bbl Vapor Liquid 1,000 100 1000 10000 IHS data Rate mcfd H. Cander 2013 11
IP30 MCFD vs. GOR 1000000 100000 GOR Scf/bbl 10000 Vapor Liquid 1000 0 1000 2000 3000 4000 5000 6000 7000 8000 9000 10000 Rate MCFD IP30 H. Cander 2013 44
Liquids Rate (IP30 BOPD) vs. GOR Data from mid-2011 100,000 GOR scf/bbl 10,000 Vapor Liquid 1,000 100 0 500 1000 1500 2000 IP30 H. Cander 2013 12
IP30 BOPD vs. GOR 100000 GOR 10000 Scf/bbl Vapor Liquid 1000 100 0 500 1000 1500 2000 2500 3000 Rate BOPD IP30 H. Cander 2013 13
Oil Rate (IP30 BOPD) vs. GOR Karnes, DeWitt, Wilson, Gonzales Counties in 2012 100000 GOR 10000 scf/bbl Vapor Vapor Liquid Liquid 1000 100 0 500 1000 1500 2000 IP30 BOPD H. Cander 2013 14
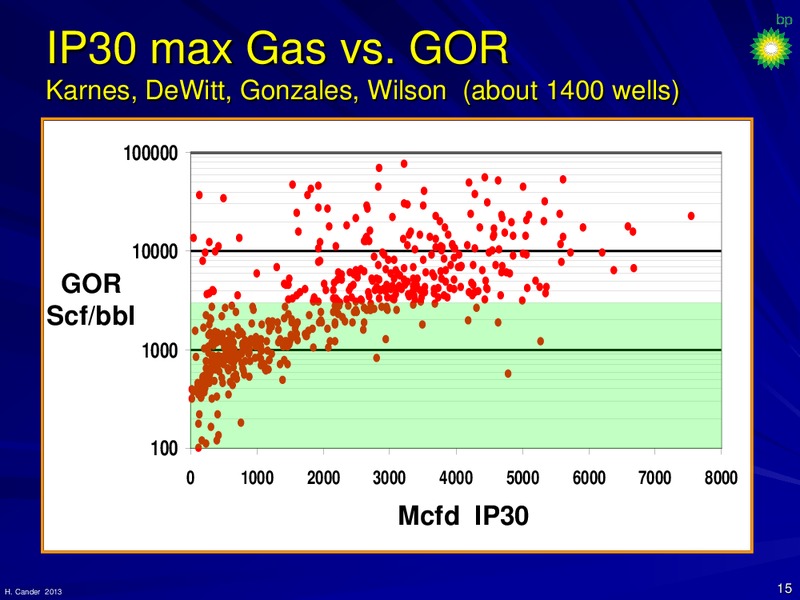
IP30 max Gas vs. GOR Karnes, DeWitt, Gonzales, Wilson (about 1400 wells) 100000 10000 GOR Scf/bbl 1000 100 0 1000 2000 3000 4000 5000 6000 7000 8000 Mcfd IP30 H. Cander 2013 15
Oil Wells with 1000 BOPD IP30 Area where 1000 3000 GOR occurs at highest pressure 1000 BOPD 1400 BOPD H. Cander 2013 16
Eagle Ford liquids sweet spot How to predict composition and pressure Reservoir Pressure psi H. Cander 2013 17
Instantaneous vs. Cumulative GOR increases during generation 120 C Trap 150 C Instantaneous Cumulative 180 C Trap H. Cander 2013 18
Instantaneous vs. Cumulative GOR Western Eagle Ford organofacies vapor GOR liquid scf/bbl H. Cander 2013 19
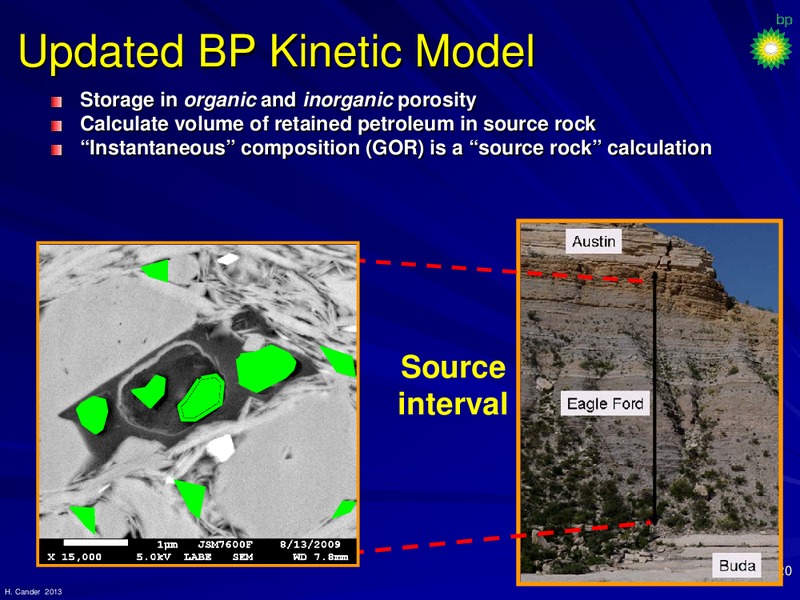
Previous kinetic model Reach sorption threshold of kerogen and then expulsion Problem Source rocks retain more petroleum than previously thought Expel less than previously thought H. Cander 2013 43
Updated BP Kinetic Model Storage in organic and inorganic porosity Calculate volume of retained petroleum in source rock Instantaneous composition (GOR) is a source rock calculation Source interval 20 H. Cander 2013
Model the petroleum generation, plus Changes in inorganic and organic porosity Porosity (fraction) 0.01 0.1 1 8% TOC 0 Carbonate-rich 500 Over-pressured 1000 1500 Inorganic porosity High Sw Depth 2000 (m) 2500…
GOR predicted from Thermal Stress GOR is close to an Instantaneous Composition Thermal Stress GOR scf/bbl H. Cander 2013 22
PVT GOR vs. Predicted GOR Actual: 6,509 Model: 4,500 Actual: 1,916 Model: 2,800 Actual: 14,680 Model: 13,200 PVT data courtesy of Corelab H. Cander 2013 23
Eagle Ford Viscosity (modeled) Viscosity cp k * H *DP Q = m High pressure helps mobility of more viscous liquid phase fluids H. Cander 2013 24
What about Pressure k * H *DP Q = m H. Cander 2013 25
Over-pressure in source rocks Due to Petroleum generation Due to Rapid burial Compaction disequilibrium How is over-pressure preserved H. Cander 2013 26
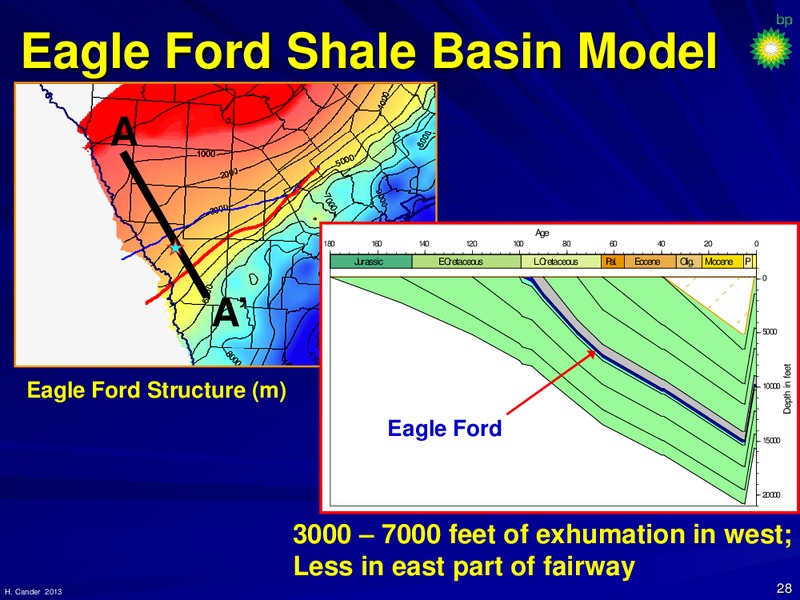
Eagle Ford Shale Basin Model A Age 180 160 140 120 100 80 60 40 20 0 Jurassic E.Cretaceous L.Cretaceous Pal. Eocene Olig. Miocene P 0 A 5000 Depth in feet Eagle Ford Structure (m) 10000 Eagle Ford 15000…
NW-SE Dip section Maverick Dimmit Webb Eagle Ford H. Cander 2013 29
Eagle Ford Petroleum Charge Vertical Migration from Eagle Ford Eagle Ford charges overlying units Eagle Ford also expels downward into Buda H. Cander 2013 30
Phase Liquid updip & above vapor Eagle Ford Note vertical maturity trend in overlying Upper Cretaceous strata H. Cander 2013 31
Basin overpressure during Eocene With petroleum generation & expulsion Eagle Ford expulsion Without petroleum generation & expulsion Still have overpressure H. Cander 2013 32
Difference in over-pressure With and without petroleum generation & expulsion With petroleum Without petroleum generation & expulsion generation & expulsion Depth (m) Eagle Ford Eagle Ford 0.74 psi/ft 0.66 psi/ft Real well…
Drop in Effective Stress in Eagle Ford Preservation of pore throats Depth (ft) Eagle Ford Effective Stress (psi) Permeability is not just a function of facies or the rock Permeability is also a function of pore pressure H.…
Gas window and Over-pressure Not completely linked Why not Over-pressure in the Eagle Ford psi above hydrostatic 85 Ma Post-Laramide exhumation in west causes loss of over-pressure and decoupling of GOR and pressure contours…
Exhumation: loss of pressure Anadarko Arkoma Minor exhumation High exhumation Over-pressure preserved Over-pressure lost Isopach of eroded section H. Cander 2013 36
Exhumation and Over-pressure Fairway Exhumation Over-pressure Arkoma Woodford 10,000 ft Mild to none Foreland Fayetteville 10,000 ft Mild to none Foreland Anadarko Woodford < 6,000 ft High Failed rift Haynesville < 6,000 ft High…
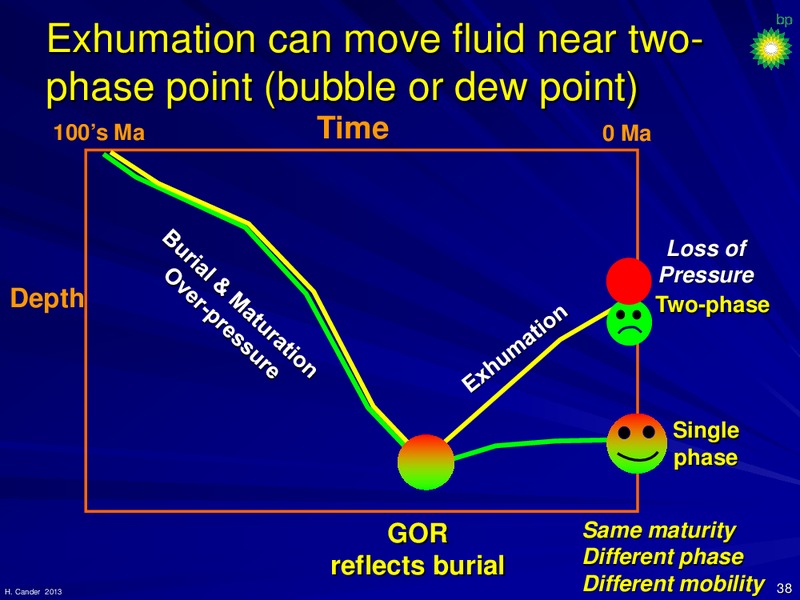
Exhumation can move fluid near two- phase point (bubble or dew point) 100s Ma Time 0 Ma Loss of Pressure Depth Two-phase Single phase GOR Same maturity reflects burial Different phase H. Cander 2013 Different mobility…
When might GOR prediction fail Substantial uplift Fluid goes two-phase during uplift Produced GOR is higher than predicted Wrong kinetic model Kinetics change as Organofacies change Frack into depleted area Frack into underlying…
Summary: Sweet Spots k * H *DP Q = m Fluid viscosity and reservoir pressure First order controls on sweet spots in shale Retained petroleum predicted by right kinetic model Viscosity and GOR are directly linked to maturity…
Thanks Harris Cander BP Slides available at AAPG Search & Discovery Cander, H., 2012 H. Cander 2013 41
 Loading...