USA Compression Partners, LP National Association of Publicly Traded Partnerships 2013 MLP Investor Conference May 23, 2013
USA Compression Snapshot Leading Domestic Provider of Contract Compression Services Partnership Overview Horsepower Breakdown (as of 3/31/13) % of One of the largest independent providers of Unit HP on Total HP Total compression…
Fueling the Shale Gas Revolution Unconventional Resource Plays Drive USACs Growth Unprecedented Growth from Shale Basins (1) Location is Critical Bcf/d USA Compression has geographic diversity 7.0 while focusing in areas of high…
Industry Fundamentals Shale Gas The Industry Gamechanger Hist. and Proj. Natural Gas Production (1) Increasing Compression Needs (2)(3) Tcf 33 Tcfe (HP) 35 USAC believes 350,000 compression needs 30 Shale Gas for unconventional…
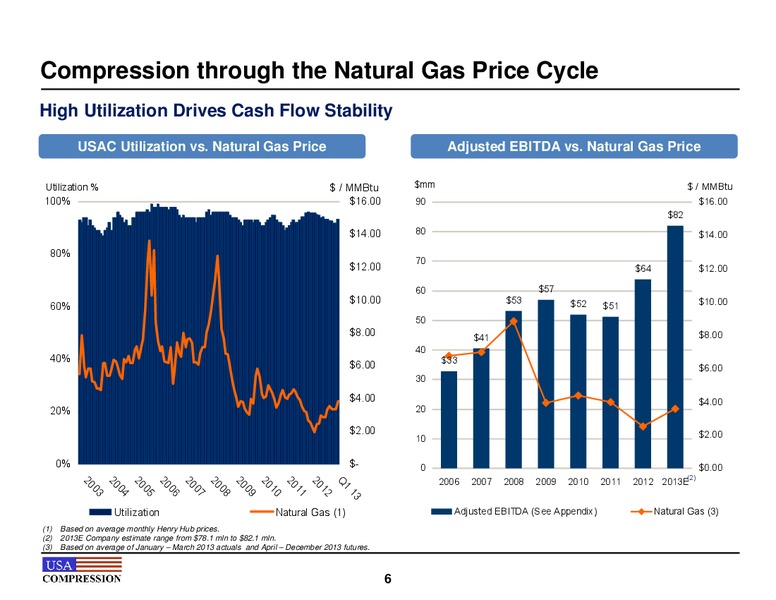
Compression through the Natural Gas Price Cycle High Utilization Drives Cash Flow Stability USAC Utilization vs. Natural Gas Price Adjusted EBITDA vs. Natural Gas Price Utilization % / MMBtu mm / MMBtu 100% 16.00 90 16.00 82 14.00…
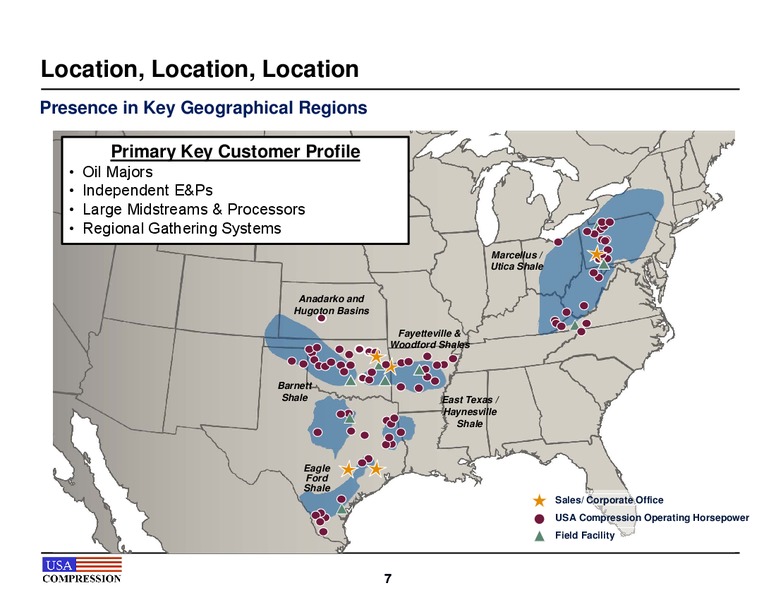
Location, Location, Location Presence in Key Geographical Regions Primary Key Customer Profile Oil Majors Independent E&Ps Large Midstreams & Processors Regional Gathering Systems Marcellus / Utica Shale Anadarko and Hugoton…
Key Investment Considerations USAC assets located in the most prolific shale basins, benefitting from new drilling activity and Exposure to High meaningful infrastructure build-out Growth Shale Plays Significant presence in areas…
Financial Overview
Unit Price & Trading Volume Since IPO (1) 1,000,000 900,000 800,000 700,000 600,000 500,000 400,000 300,000 200,000 100,000 0 Volume (1) Day 1 and day 2 of trading, January 15th and 16th, are excluded from the graphs…
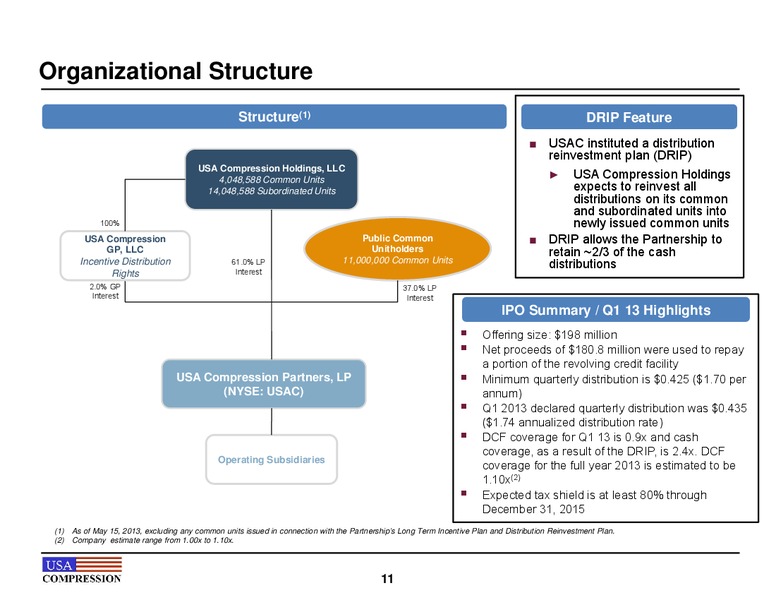
Organizational Structure Structure(1) DRIP Feature USAC instituted a distribution reinvestment plan (DRIP) USA Compression Holdings, LLC 4,048,588 Common Units USA Compression Holdings 14,048,588 Subordinated Units expects to…
Financial Strategy Maintain stable cash flow platform with long-term customer contracts and high utilization Maintain Stable Continue focus on large horsepower compression units to provide Cash Flows growth to current stable,…
Sources & Uses and Pro Forma Capitalization Sources & Uses Pro Forma Capitalization Actual Capitalization As of ( in thousands) December 31, As of ( in thousands) 2012 March 31, Sources As Adjusted 2013 Gross IPO Proceeds 198,000 Cash…
Q&A
Appendix
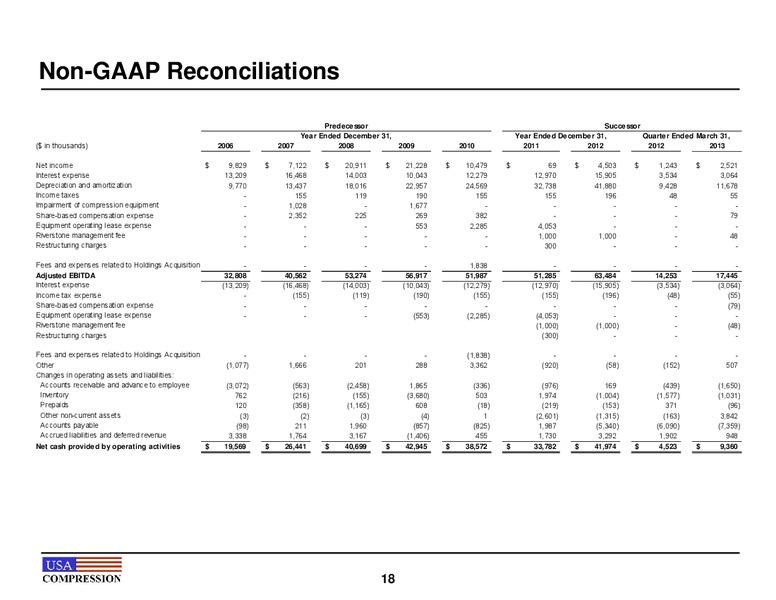
Non-GAAP Reconciliations Predecessor Successor Year Ended December 31, Year Ended December 31, Quarter Ended March 31, ( in thousands) 2006 2007 2008 2009 2010 2011 2012 2012 2013 Net income 9,829 7,122 20,911 21,228 10,479 69 4,503…
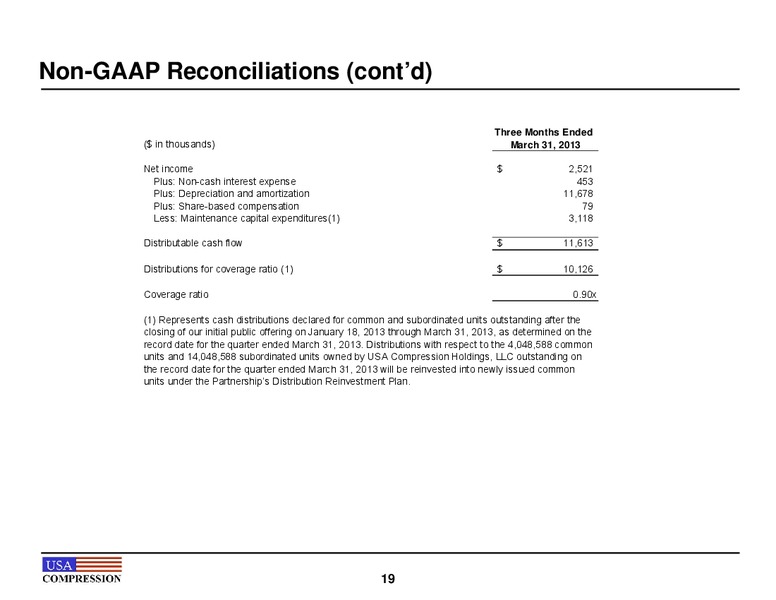
Non-GAAP Reconciliations (contd) Three Months Ended ( in thousands) March 31, 2013 Net income 2,521 Plus: Non-cash interest expense 453 Plus: Depreciation and amortization 11,678 Plus: Share-based compensation 79 Less:…
 Loading...