Connecting opportunities Connecting resources to markets through a sustainable strategy Investor Presentation for North American Investors June 2015
Australias largest gas pipeline owner by pipeline length, capacity and volume APA Overview (Ticker: APA AU) Normalised Continuing Business EBITDA(1) 800m Market capitalisation A10.4billion (as at 29 May 2015) Full years Half years…
APA Group June 2015 3
Stable and predictable cashflows Customers associated with many contracted assets provide essential services: Regulated gas distribution systems Major power generation facilities Counterparty credit ratings by contracted volumes(1)…
APAs long term strategy Consistent execution of a sustainable growth strategy since listing in 2000 Were focused on building and enhancing our core business of gas infrastructure assets Continuing to grow our Leveraging our asset…
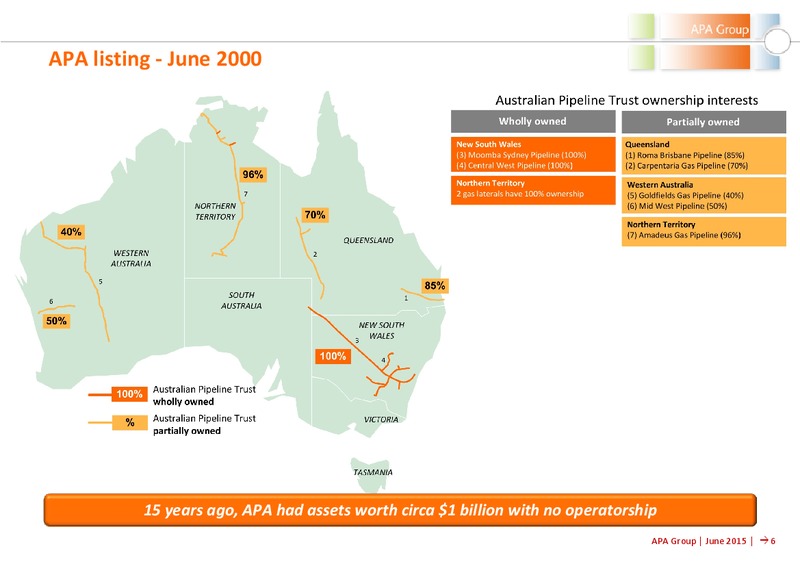
APA listing - June 2000 15 years ago, APA had assets worth circa 1 billion with no operatorship APA Group June 2015 6
Own and/or operate 19 billion of assets - June 2015 Today, APA is the largest gas infrastructure portfolio in Australia in terms of scale and geographic diversity APA Group June 2015 7
Construction of the new Eastern Goldfields Pipeline, 162 km looping of APAs Victorian Northern WA is well underway with almost half of the 292 km Interconnect is almost complete, enabling more gas to of pipe strung along the route.…
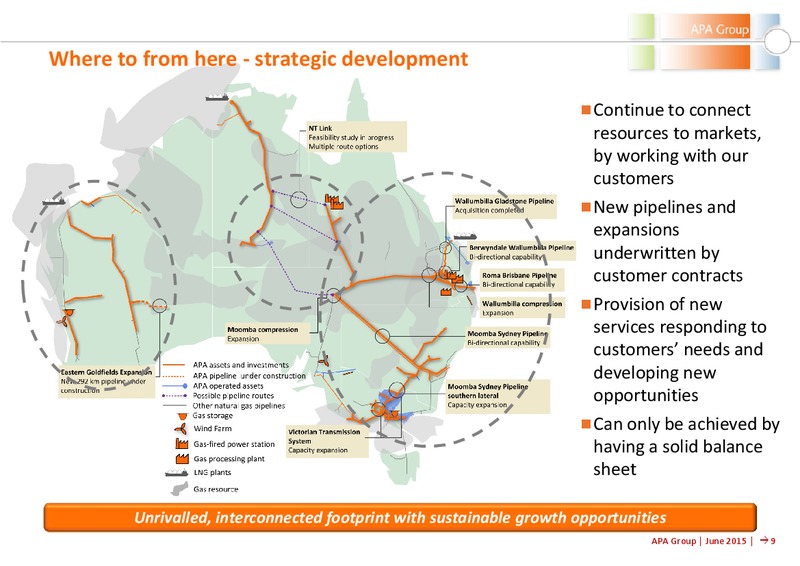
Where to from here - strategic development Continue to connect resources to markets, by working with our customers New pipelines and expansions underwritten by customer contracts Provision of new services responding to…
Key initiative - east coast grid innovation Transformational change in service provision - seamless, flexible, new options/solutions Ongoing development and growth opportunities APAs east coast grid is responding to the…
Production vs Consumption in the east 800 PJ Gas Consumption TAS by Eastern States SA Gas Production by Eastern regions Otway / Bass / Gippsland VIC Sydney NSW Cooper Bowen / Surat QLD 2010 201020112011 2010 2012…
Wallumbilla Gladstone Pipeline(1) acquisition - adds 543 km and - access to Gladstone (1) QCLNG Pipeline renamed on change of ownership to APA Creation of 7,500 km of interconnected grid with access to export market and highly…
Wallumbilla Gladstone Pipeline acquisition Financial close reached on 3 June 2015 Final acquisition price of US4.6 billion 20 year take-or-pay contracts with BG Group and CNOOC entities Tariffs escalating by US CPI for term of…
Emerging opportunity - NT Link Options Short/quick - Mount Isa: 600 km Long/ - Moomba: 1,175 km or somewhere in between Why link NT has 200,000 PJ of gas resources(1) Seamless transport between Timor Sea, Bass Strait, Sydney…
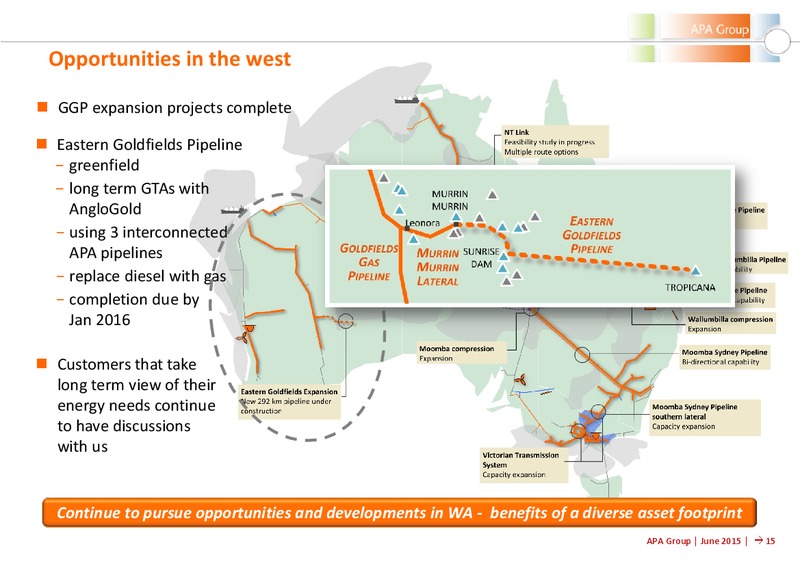
Opportunities in the west GGP expansion projects complete Eastern Goldfields Pipeline greenfield long term GTAs with AngloGold using 3 interconnected APA pipelines replace diesel with gas completion due by Jan 2016…
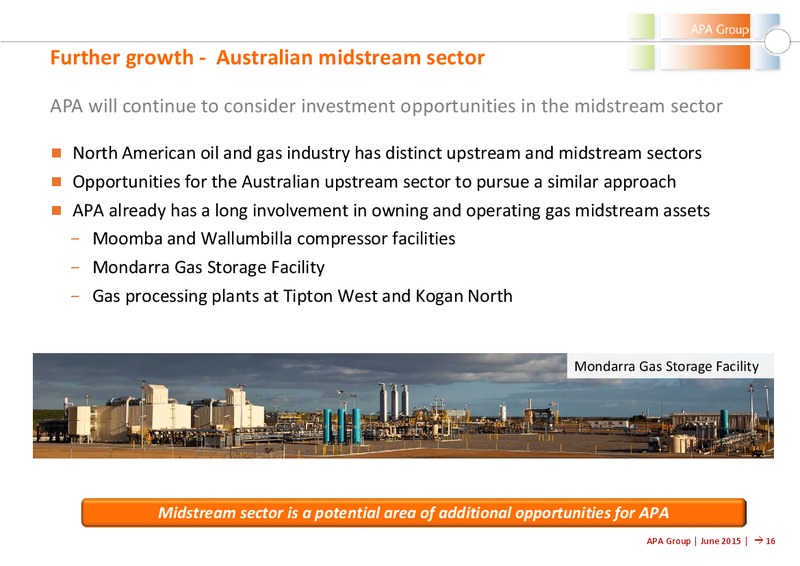
Further growth - Australian midstream sector APA will continue to consider investment opportunities in the midstream sector North American oil and gas industry has distinct upstream and midstream sectors Opportunities for the…
Operational excellence - IOC APAs new Integrated Operations Centre will provide seamless service to our customers on the east coast grid Better response to market changes Integrated Operations Centre, Brisbane Holistic management of…
Maintaining a strong balance sheet Growth needs to be sustainably funded with appropriate capital structure APAs Distribution Policy Fully covered by OCF Sustainable over the long term Capital Management 31 Dec 2014 30 Jun 2014…
Long term, diverse debt portfolio March 15 issuance ongoing access to global markets: EUR700m 7yr notes 1.375% coupon Weighted average interest rate EUR650m 12yr notes 2.0% coupon applying to drawn debt reduced to 5.6%* GBP600m 15yr…
Focus on safety and operational excellence Health and safety Long-term safety goal of Zero Harm a program of continuous improvement LTIFR Decrease of LTIFR (1) to 0.7 (FY14), down from 2.1 (FY13) 7.3 6.1 LTIFR as at 31 Dec 2014…
APA - connecting resources to markets Largest gas infrastructure portfolio in Australia in terms of scale and geographic diversity Unrivalled, interconnected footprint with sustainable growth opportunities Stable and…
Page Intentionally Left Blank
Financial Highlights APA Group June 2015 23
Proven growth and value creation Revenue EBITDA 1,200m Full years Half years 1,000m Full years Half years 850(1) 993 1,000m 920 800m 764 747 800m 720 758 673 660 600m 447 526 460 492 600m 510 523 444 399 400m 400m 200m…
Maximising value for securityholders Total securityholder returns since listing APA TSR: 1,394% 1600 APA CAGR: 19.9% 1400 1200 1000 800 600 400 200 0 APA Total securityholder return Total annual returns S&P / ASX 200…
Sound financial performance million 1H 15 1H 14 Change Statutory results EBITDA 849.6 398.9 up 113%(4) Net profit after tax 467.3 120.7 up 287%(4) Operating cash flow (1) 280.4 208.3 up 35%(4) Operating cash flow per security…
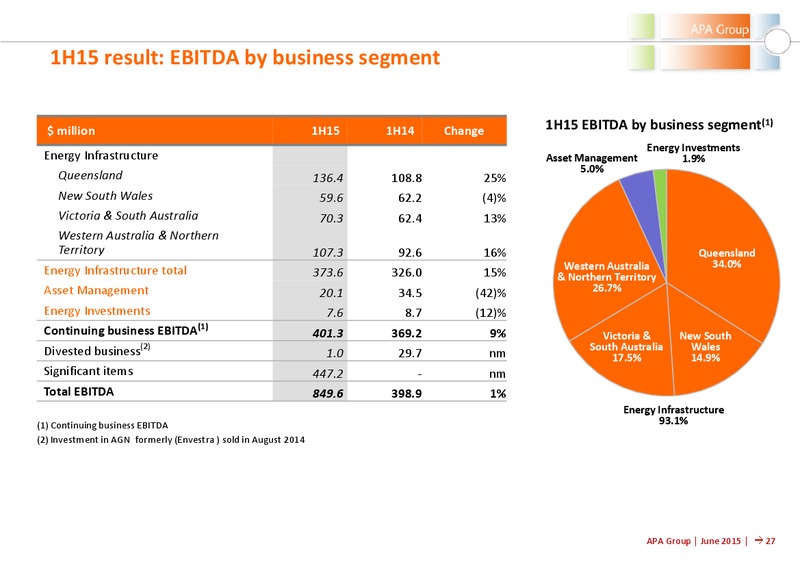
1H15 result: EBITDA by business segment million 1H15 1H14 Change 1H15 EBITDA by business segment(1) Energy Investments Energy Infrastructure Asset Management 1.9% 5.0% Queensland 136.4 108.8 25% New South Wales 59.6 62.2 (4)%…
1H15 Operational summary Energy Infrastructure EBITDA by asset Expansion of the East coast grid capacity and service 1H15 offerings continues: Moomba / Wallumbilla compressions completed 1H14 BWP bi-directional installed Victoria…
Capital expenditure million 1H15(1) 1H14(1) Growth capex Actual & Committed Growth capex Regulated - Victoria 55.5 14.9 400m Major Projects Queensland 78.5 93.6 300m New South Wales 0.6 4.8 Western Australia 14.1 39.1 Other…
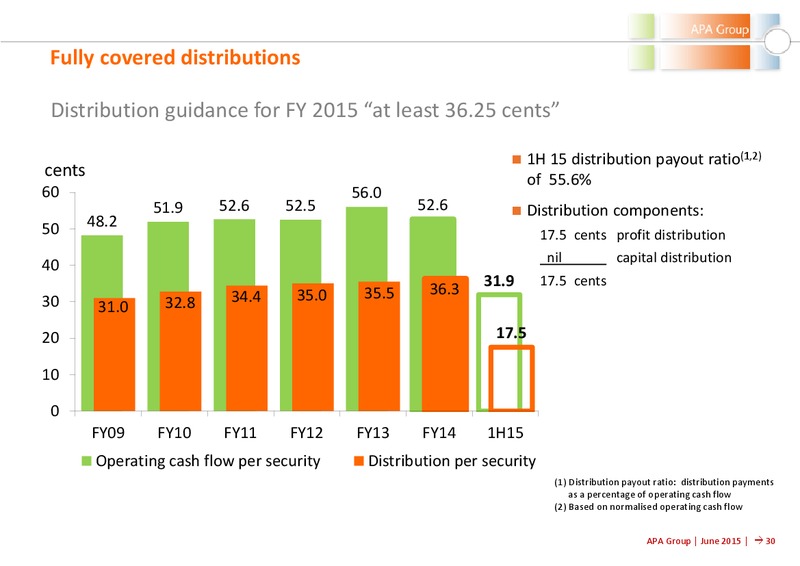
Fully covered distributions Distribution guidance for FY 2015 at least 36.25 cents 1H 15 distribution payout ratio(1,2) cents of 55.6% 60 56.0 51.9 52.6 52.5 52.6 Distribution components: 50 48.2 17.5 cents profit distribution nil…
For further information contact Delivering Australias Energy Yoko Kosugi Head of Investor Relations, APA Group Tel: +61 2 9693 0049 E-mail: yoko.kosugiapa.com.au or visit APAs website www.apa.com.au
 Loading...