West Coast Investor Meetings Arranged by Tudor, Pickering, Holt & Co. May 18-19, 2015
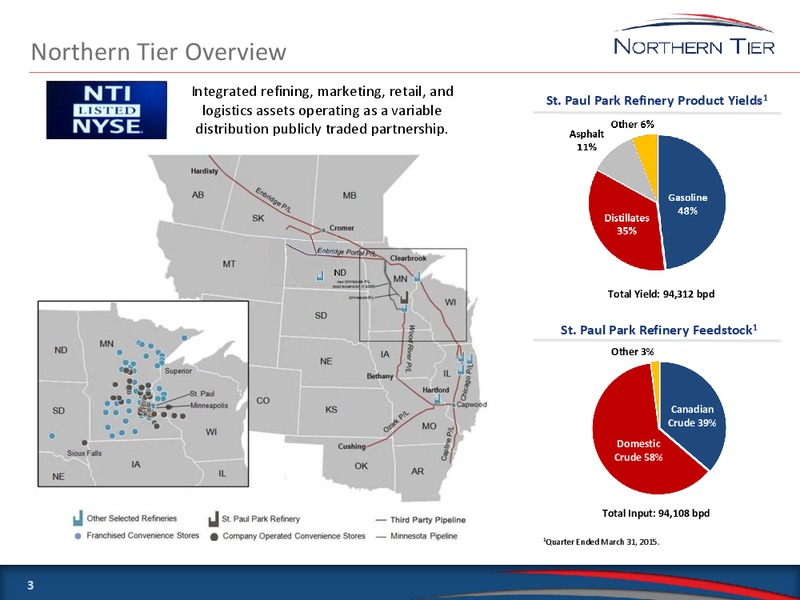
Northern Tier Overview Integrated refining, marketing, retail, and St. Paul Park Refinery Product Yields1 logistics assets operating as a variable distribution publicly traded partnership. Other 10% Gasoline 46% Total Yield:…
Flexible Refinery with Crude Oil Advantage Redundant refining assets, allowing for higher refinery utilization and increased maintenance flexibility Operational Redundancy Refinery configuration allows it to process a variety of light,…
Refinery Benchmarking Source: Company filings. Ordered by full year 2014 results. 1Excludes lower of cost or market adjustments 2 Adjusted for FIFO impact 3 Excludes LIFO gain 5
June 30, 2012 Integrated Marketing Channel Northern Tiers integrated marketing network included 165 Total Retail Fuel Sold (000 gal/store/month) (company-operated stores) company-operated and 95 franchised SuperAmerica convenience…
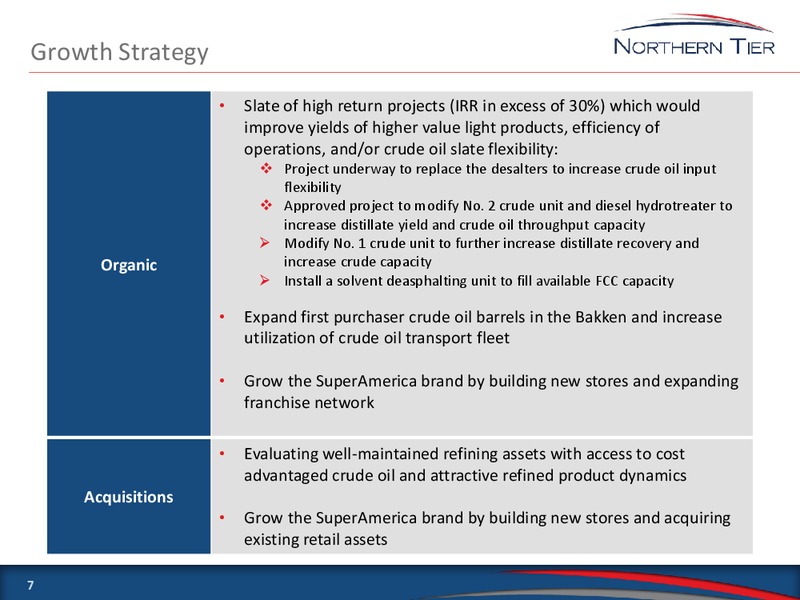
Growth Strategy Slate of high return projects (IRR in excess of 30%) which would improve yields of higher value light products, efficiency of operations, and/or crude oil slate flexibility: Project underway to replace the desalters to…
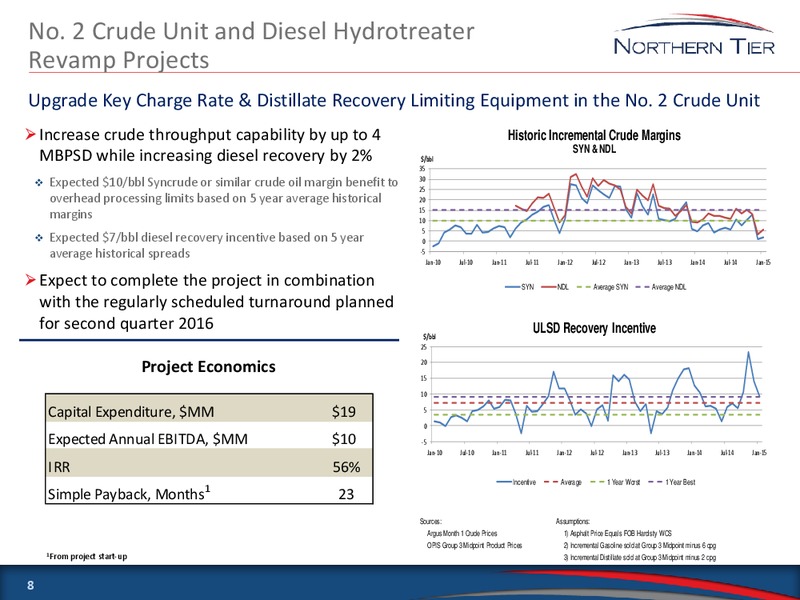
No. 2 Crude Unit and Diesel Hydrotreater Revamp Projects Upgrade Key Charge Rate & Distillate Recovery Limiting Equipment in the No. 2 Crude Unit Increase crude throughput capability by up to 4 Historic Incremental Crude Margins SYN &…
Crude Unit Desalter Project Replace Existing Single Stage Desalters with State of the Art Two Stage Desalters Gain optionality to replace up to 10 MBPSD of Canadian Syncrude with higher valued crude oils Expected 5/bbl margin benefit…
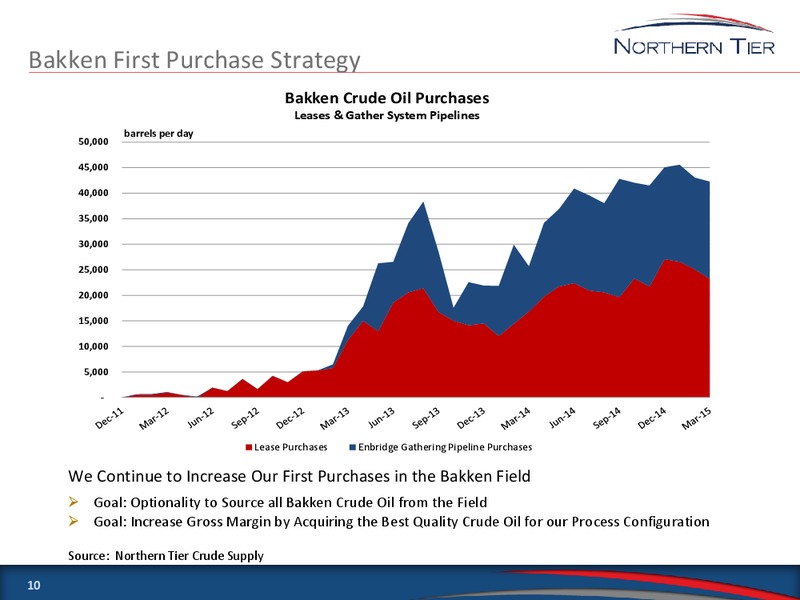
Bakken First Purchase Strategy Bakken Crude Oil Purchases Leases & Gather System Pipelines barrels per day 50,000 45,000 40,000 35,000 30,000 25,000 20,000 15,000 10,000 5,000 - Lease Purchases Enbridge…
Key Business Highlights Strategically-Located Refinery with Advantaged Access to Crude Oil Supplies and Attractive Refined Product Outlets Integrated Refining, Marketing, Retail, and Logistics Operations Flexible Refinery with…
APPENDIX
Q1 Financial Summary Refining Gross Margin1 Total Refinery Throughput ( per throughput barrel) (thousands of barrels per day) Adjusted EBITDA2 and Refining Direct Operating Expenses3 Cash Available for Distribution ( per…
Key Refining Performance Metrics Gross Margin1 Total Refinery Throughput ( per throughput barrel) (thousands of barrels per day) 35.00 100.0 93.5 29.56 30.00 83.9 80.0 75.5 25.00 19.15 20.00 18.04 60.0 15.00 40.0 10.00 5.00…
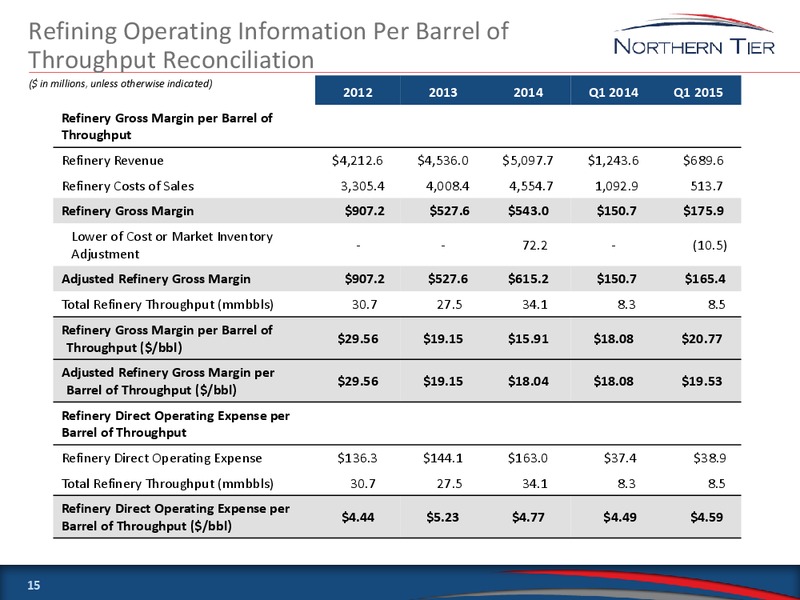
Refining Operating Information Per Barrel of Throughput Reconciliation ( in millions, unless otherwise indicated) 2012 2013 2014 Q1 2014 Q1 2015 Refinery Gross Margin per Barrel of Throughput Refinery Revenue 4,212.6 4,536.0 5,097.7…
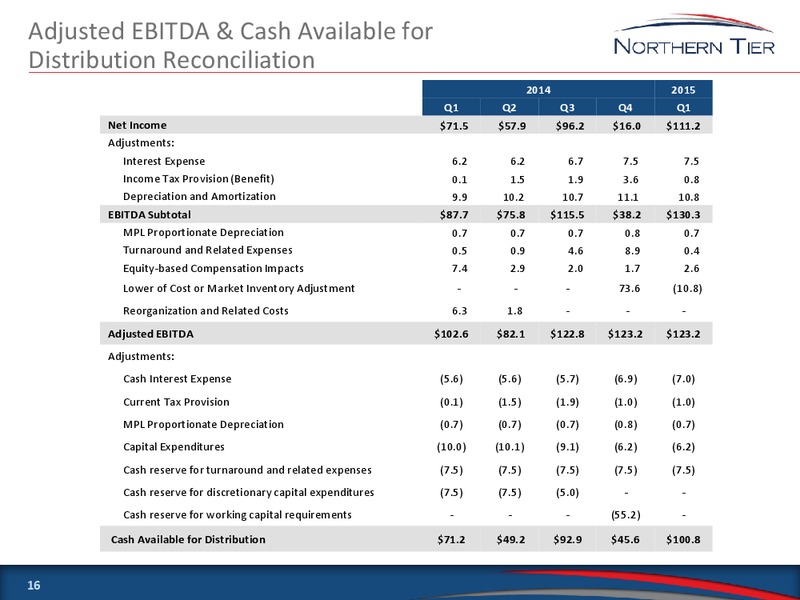
Adjusted EBITDA & Cash Available for Distribution Reconciliation 2014 2015 Q1 Q2 Q3 Q4 Q1 Net Income 71.5 57.9 96.2 16.0 111.2 Adjustments: Interest Expense 6.2 6.2 6.7 7.5 7.5 Income Tax Provision (Benefit) 0.1 1.5 1.9 3.6 0.8…
Reconciliation of No. 2 Crude Unit Revamp Project Annual Forecasted Net Income to Annual Forecasted EBITDA ( in millions) Annual Forecasted Net Income1 9.3 Add: Estimated Depreciation and Amortization 0.7 Annual Forecasted…
Reconciliation of Desalter Project Annual Forecasted Net Income to Annual Forecasted EBITDA ( in millions) Annual Forecasted Net Income1 20.5 Add: Estimated Depreciation and Amortization 1.5 Annual Forecasted EBITDA 22.0…
 Loading...