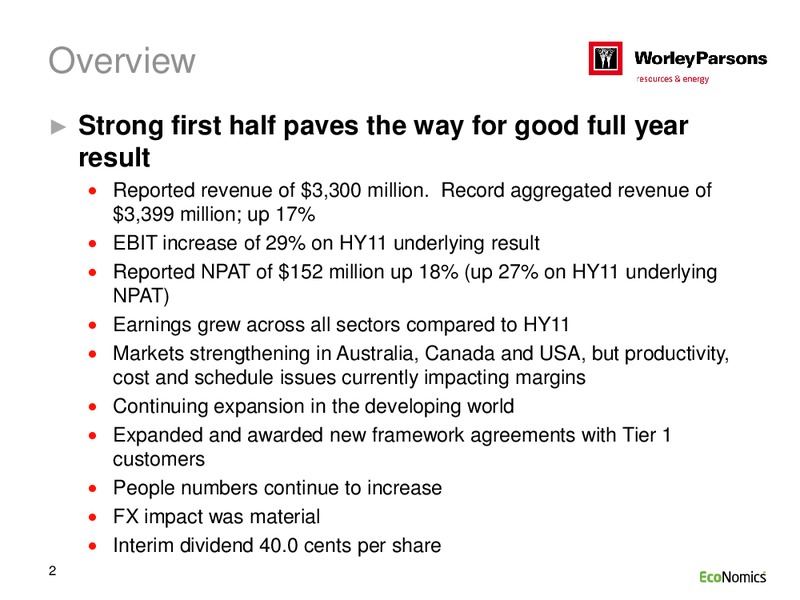
Overview Strong first half paves the way for good full year result Reported revenue of 3,300 million. Record aggregated revenue of 3,399 million; up 17% EBIT increase of 29% on HY11 underlying result Reported NPAT of 152 million up…
Financial highlights HY12 vs HY11 HY12 Underlying Results* Net profit after tax 152m 27% Aggregated revenue 3,399m 17% EBIT 248m 29% Operating cash flow 64m 49% Basic earnings per share 61.8 c/s 27% Interim dividend 40.0 c/s…
Safety performance Our safety performance remains solid Areas of focus Project and site activity initiation and implementation for safety success Road safety. Pledged to the UN Global Road Safety Commitment program Highlights…
Snapshot Capital spending in resource markets continue to increase, led by global majors in Hydrocarbons and Minerals & Metals Solid growth in Australia, Canada, USA and China Economic uncertainty in light of the Eurozone debt…
Snapshot Our focus on the developing world has led to key project awards in: Brazil Costa Rica Ecuador Indonesia South Africa Board composition The Board has been strengthened Ms Wang Xiao Bin; and Dr Christopher Haynes 6
Local delivery, Global support 2.1 million workshare hours 37,800 people 148 offices 44 countries 7
Improve contracts WorleyParsons performance continues to be underpinned by our extensive long-term contract base Total of 18 new Improve contracts awarded 11 contracts renewed 240 Improve contracts Our selection was based upon:…
Sector reporting change Group wide organisation restructure Outstanding location based delivery effective global support Five Regions into Nine groups of locations 1. Australia East and New Zealand (AENZ) 1. Australia and New…
Change in net profit after tax HY2011 v HY2012 14.2 (11.5) 31.3 (4.4) (19.5) (3.9) (10.1) 4.8 31.8 151.9 m 119.2 HY11 * Hydrocarbons Power Minerals & Infrastructure & Corporate Net Interest Income Tax Minority FX Impact…
Cash Flow m HY08 HY09 HY10 HY11 HY12 EBIT 232 315 210 203 248 Depreciation and amortisation 31 40 43 47 50 Interest and tax paid (75) (103) (132) (56) (64) Working capital / other (76) (17) 27 (69) (170) Net cash inflow from…
Gearing and key metrics Key Metrics FY09 FY10 FY11 HY12 Gearing ratio 26% 26% 22% 26% Facility utilization 54% 61% 53% 60% Average cost of debt 5.5% 5.2% 5.7% 5.3% Average maturity (years) 4.1 3.8 4.6 4.1 Interest cover * 14.1x…
Liquidity Liquidity Summary m FY09 FY10 FY11 HY12 Loan & OD facilities 1,376 1,286 1,277 1,341 Less: facilities utilized (745) (782) (680) (809) Available facilities 631 504 597 532 Plus: cash 178 141 171 165 Total liquidity…
Sector Outlook 2012 John Grill
Hydrocarbons Hydrocarbons market remains buoyant HY12 vs HY11 fuelled by sustained high oil prices Aggregated 2,345 m 19% Capital spend by the international majors Revenue increased by 19% in CY11 EBIT 263 m 6.9% Unconventional…
Hydrocarbons Key project awards ExxonMobil - Point Thompson initial production system, Alaska SORESCO - Moin refinery expansion project, Costa Rica PetroEcuador - Refineria del Pacifico Refining and Petrochemical Complex project,…
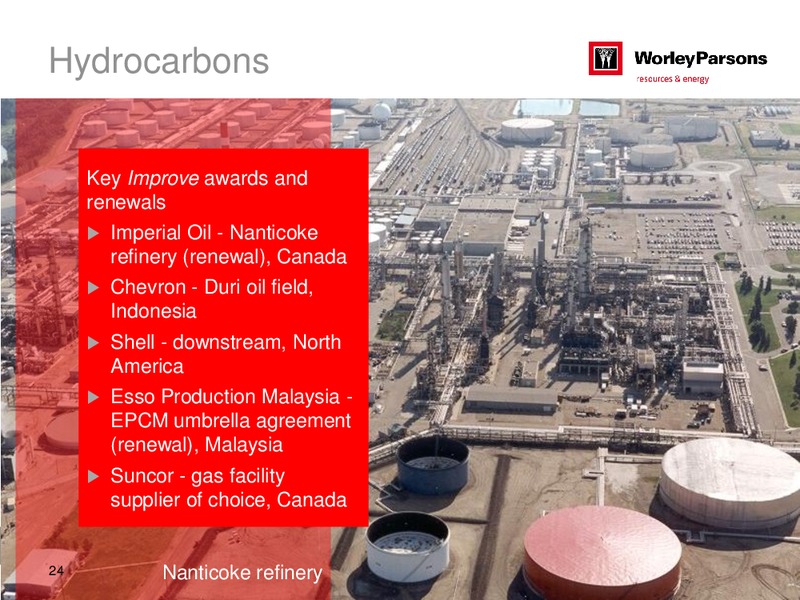
Hydrocarbons Key Improve awards and renewals Imperial Oil - Nanticoke refinery (renewal), Canada Chevron - Duri oil field, Indonesia Shell - downstream, North America Esso Production Malaysia - EPCM umbrella agreement…
Hydrocarbons Segment outlook Growth and strengthening in global Improved outlook for the downstream greenfield and Improve markets hydrocarbons, particularly in the USA Increase in Select opportunities and Latin America resulting from…
Power Developed world - optimisation of existing HY12 vs HY11 generation and networks assets Aggregated 260 m 6.6% Developing world - new generation capacity Revenue and networks to meet rising demand EBIT 27 m 15% Nuclear…
Power Key project awards Akkuyu NGS Elektrik Uretim Anonim Sirketi - nuclear power plant project, Turkey King Abdullah City for Atomic and Renewable Energy - nuclear power plant siting services project, Saudi Arabia Inter RAO UES…
Power Key Improve awards and renewals Kozloduy - stress-tests for nuclear power facilities, Bulgaria Bruce Power - sustaining projects, Canada Ontario Power Generation - Nuclear Division, Canada Arizona Public Services - Palo…
Power Segment outlook Expect continued growth in the nuclear sector Developments in the US provide opportunity for near term growth Pipeline of works in developing markets for major new generation projects Recent Improve awards in…
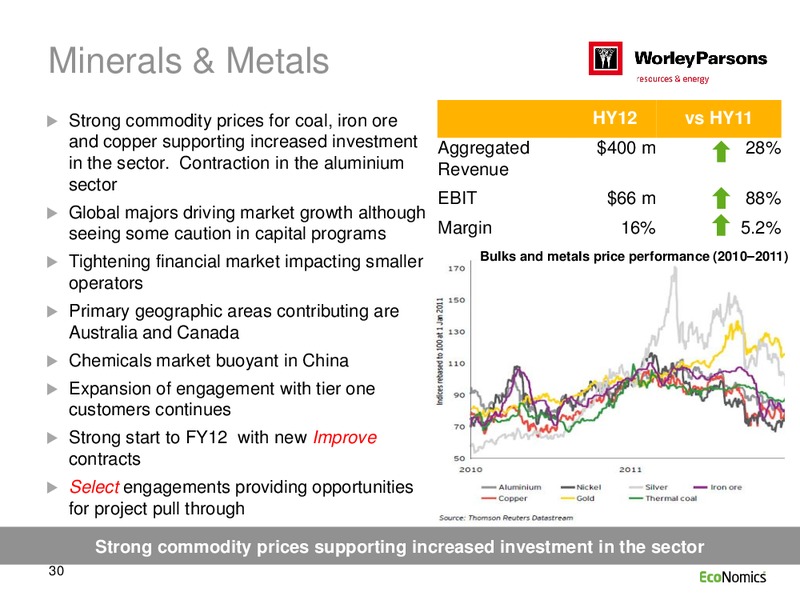
Minerals & Metals Strong commodity prices for coal, iron ore HY12 vs HY11 and copper supporting increased investment Aggregated 400 m 28% in the sector. Contraction in the aluminium Revenue sector EBIT 66 m 88% Global majors driving…
Minerals & Metals Key project awards Sasol Shondoni coal mine development EPCM, South Africa MMX Mineracao e Metalicos Serra Azul iron ore facilities expansion, Brazil Anglo American Chagres copper smelter engineering, Chile…
Minerals & Metals Key Improve awards and renewals BHP Billiton Mitsubishi Alliance - engineering and construction management services for Bowen Basin coal facilities, Australia BHP Billiton - iron ore sustaining capital EPCM…
Minerals & Metals Demand shift for Commodities Segment outlook Outlook remains positive Expect continued growth in developing world in particular, Latin America, Africa and China Growth in bulk materials and chemicals markets is…
Infrastructure & Environment Resource sector demand for HY12 vs HY11 infrastructure and environmental services growing strongly Aggregated 394 m 16% Revenue Public infrastructure demand flat in the developed world but demand…
Infrastructure & Environment Key project awards Water Corporation of Western Australia - Southern Seawater Desalination plant expansion stage 2, Australia Chemtura - multi-purpose manufacturing facility project, China National…
Infrastructure & Environment Key Improve awards and renewals BP - remediation management North American framework contract (engineering and consulting), USA and Canada Port of Los Angeles - restoration services framework…
Infrastructure & Environment Segment outlook Strengthening of resource markets Remediation, decommissioning, globally provide opportunities for response and recovery activities growth increasing South African business to provide…
Summary Strong growth compared to HY11, with Expanded and awarded new framework earnings growth reported in all sectors agreements with key customers for project and Improve activity providing a Capital spend in resource markets solid…
Group outlook The group experienced strong growth in the first half compared to the previous corresponding period and, subject to the markets for our services remaining strong, we expect to achieve good growth in FY2012 compared to FY2011…
 Loading...