Overview of Par Petroleum Hawaii Refining System 94,000 bpd capacity refinery Map of Hawaiian Operations: 50% distillate yield configuration 5.4 MM barrels of storage 27 miles of clean / black oil product pipelines Single Point…
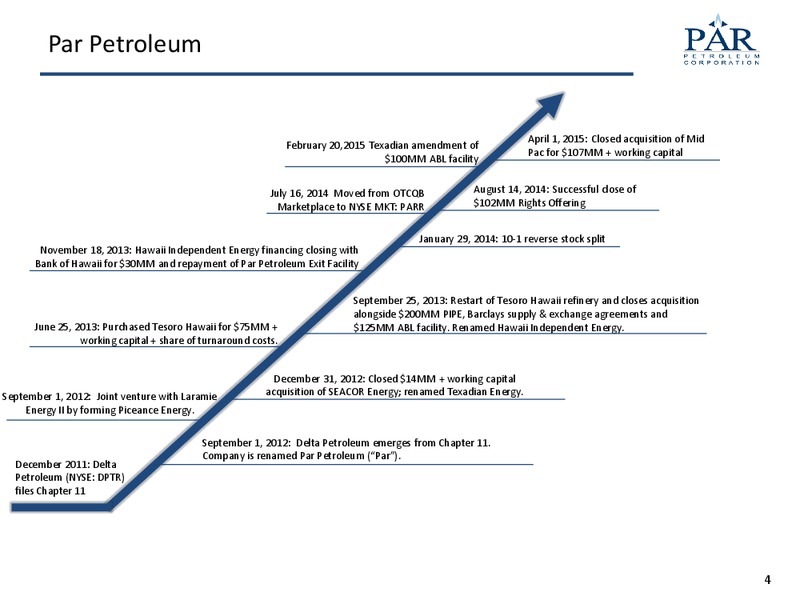
Par Petroleum April 1, 2015: Closed acquisition of Mid February 20,2015 Texadian amendment of Pac for 107MM + working capital 100MM ABL facility July 16, 2014 Moved from OTCQB August 14, 2014: Successful close of Marketplace to…
Hawaii Refinery Overview Largest refinery on the island Configured for island demand 20 MW Cogen 18,000 bpd Hydrocracker capacity Nelson complexity rating 5.7 5
Hawaii Refinery Overview 1Q 2015 Crude Mix by Source 1Q 2015 Product Yield Crude flexibility and heavily weighted distillate configuration 6
Retail and Logistics Marketing Serve 128 retail locations Retail Stores & Storage Capacity Total sales volume 135MM gallons/year (8,800 bpd) 30,000 bbls Wholesale and bulk provider on the islands 12 77 12,000 bbls Logistics…
Hawaii Market On Island Demand Distillate 110-120 MBpd Fuel Oil Import Export 5-15 MBpd Other 5-15 MBpd Par 94 MBpd Refinery 54 MBpd * Based on company analysis Hawaii Net Electricity Generation by Source Visitor…
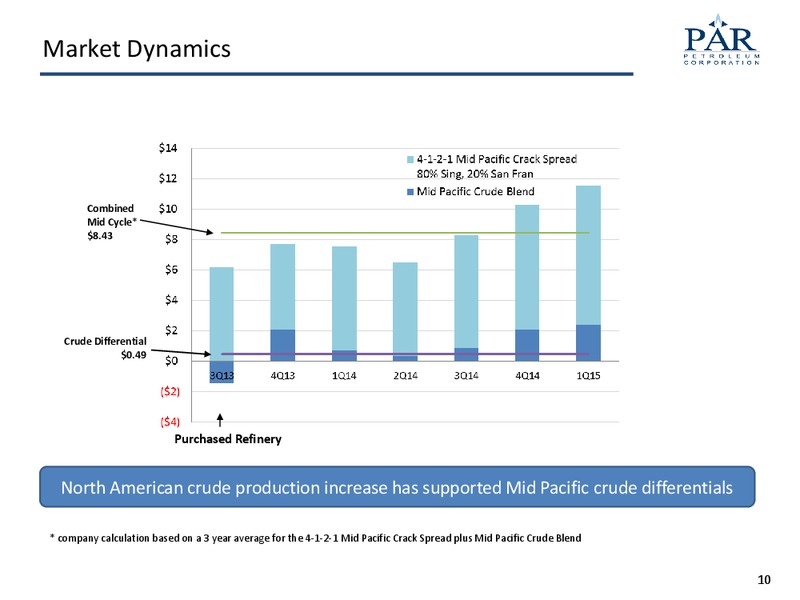
Market Dynamics Combined Mid Cycle* 8.43 Crude Differential 0.49 Purchased Refinery North American crude production increase has supported Mid Pacific crude differentials * company calculation based on a 3 year…
Piceance Energy Overview Company acreage 40,165 net acres across Colorados Piceance Basin Over 300 producing wells in one of the lowest cost gas weighted basins in the continental U.S. Over 3,500 undeveloped locations held by…
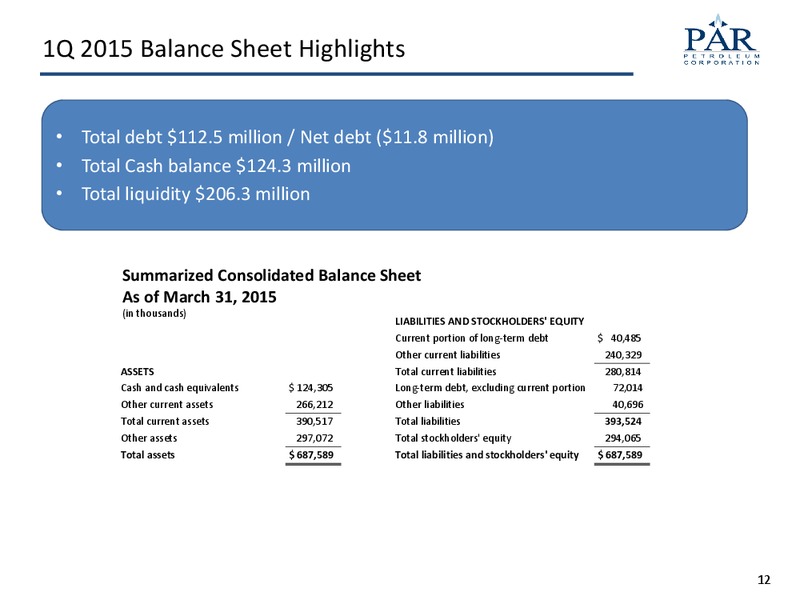
1Q 2015 Balance Sheet Highlights Total debt 112.5 million / Net debt (11.8 million) Total Cash balance 124.3 million Total liquidity 206.3 million Summarized Consolidated Balance Sheet As of March 31, 2015 (in thousands)…
Growth Initiatives 1.4 billion unrestricted net operating loss carryforward NOL Hawaii Refining & Integrated growth to market limits in Hawaii Marketing Evaluate refinery and marketing opportunities (outside Duplicating Hawaii…
Key Investment Highlights Refining and marketing in a niche market Growth oriented company with NOL High distillate yields structure Low cost natural gas production equity Canadian crude access play 14
Appendix
Enhanced Operating Stats Three Months Ended March 31, 2015 2014 Refining and Distribution Segment Total Crude Oil Throughput (Mbpd) 74.8 67.0 Source of Crude Oil: North America 45.9 % 52.3 % Latin America 13.1 % 29.4 % Africa…
Strong Capital Structure Condensed Balance Sheet March 31, December 31, (in thousands) 2015 2014 ASSETS Cash and cash equivalents 124,305 89,210 Restricted cash 749 749 Trade accounts receivable 64,780 112,968 Inventories 185,074…
 Loading...