Overview Good earnings growth delivered in FY2012. Sound platform for further growth in FY2013. Strong growth in revenue and cash from operations 77 significant new major projects and long term contract awards Increasing demand for…
Financial highlights FY12 vs. FY11 Statutory Underlying Underlying results results results* Net profit after tax 353 m 346 m 16% Aggregated revenue 7,408 m 7,363 m 25% EBIT 538 m 530 m 12% Operating cash flow 438 m 438 m 49%…
Safety performance We incurred three work related fatalities during the year, two from road accidents and one from a bacterial infection Safety remains a major focus in our business We strive for year on year improvement but this…
Snapshot Continued growth in Hydrocarbons Game changing developments and ever and Minerals, Metals & Chemicals growing demand for energy globally is particularly in Canada, Australia and driving unconventional oil and gas the USA…
Snapshot Strong focus on major global Continuing to globalise our customers Minerals, Metals & Chemicals and Developing markets continue to be Infrastructure & Environment a significant driver of growth services Latin America, Africa…
Local delivery, global support 4.9 million workshare hours (FY2011: 3.4 million) 40,800 people 163 offices 41 countries 7
Significant awards for FY2012 77 long term contracts / projects 8
Improve contracts WorleyParsons performance continues to be underpinned by our extensive long term contract base Total of 46 new Improve contracts awarded 18 contracts renewed Currently have over 260 Improve contracts Our…
Local / global model Model has been well received by our clients and our people 10
Succession On 6 July this year we announced changes to the companys leadership Andrew Wood will succeed me as Chief Executive Officer after the AGM in October Supported by an exceptional leadership team I will be taking on the…
Corporate responsibility We are on a journey to become a Corporate Responsibility leader by focusing on Governance, ethics and transparency Our people Human rights Community Fair operating practices and the supply chain The…
5 year financial profile Record aggregated revenue Good NPAT growth from FY2011 of 16% Margins impacted by a small number of underperforming projects and low margin procurement activity Effective tax rate down 3% from FY2011 to…
Half on half analysis m H1 FY2012 H2 FY2012 Total Growth% Group EBIT 248.3 282.0 530.3 14% EBIT margin 7.3% 7.1% 7.2% Group NPAT 151.9 193.7 345.6 28% Half on half NPAT* 250.0 200.0 150.0 H1 H2 100.0 193.7 179.3…
Change in net profit after tax FY2011 v FY2012 Good growth in Hydrocarbons, MM&C and I&E 17 * The underlying result for FY2012 and FY2011 excludes the fair value gain on acquisition of associates of 7.6m and 65.7m respectively.
Hydrocarbons Overall strong performance with record aggregated revenue Australia West impacted by underperformance on a few projects that have now been finalised or provided for Canadian construction business awarded a number…
Power Record aggregated revenue Fall in earnings contrary to guidance Resource sector in Australia provided growth Increased activity in the European nuclear market Latin America impacted by low margin procurement activity USA…
Minerals, Metals & Chemicals Record aggregated revenue 28% EBIT growth year on year Continuing to grow our relationships with major global companies Strong commodity prices driving demand for services Softness in the Australian…
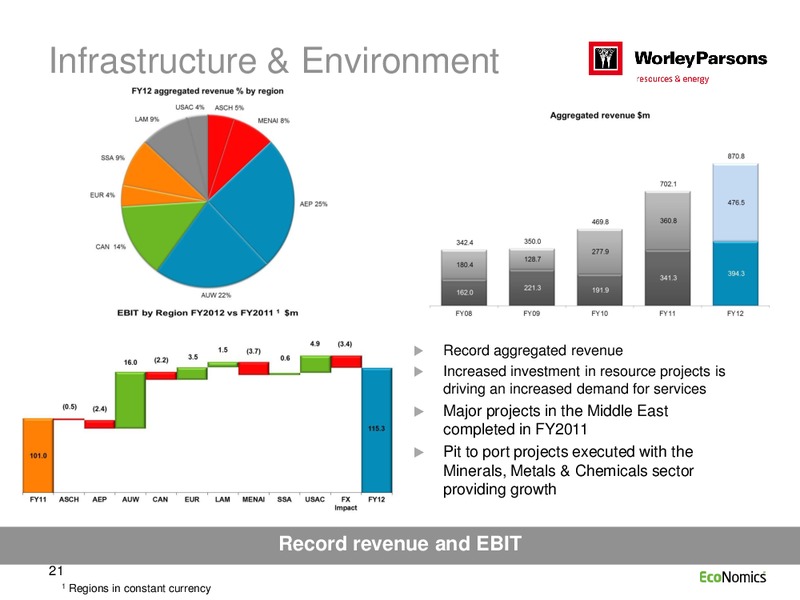
Infrastructure & Environment Record aggregated revenue Increased investment in resource projects is driving an increased demand for services Major projects in the Middle East completed in FY2011 Pit to port projects executed…
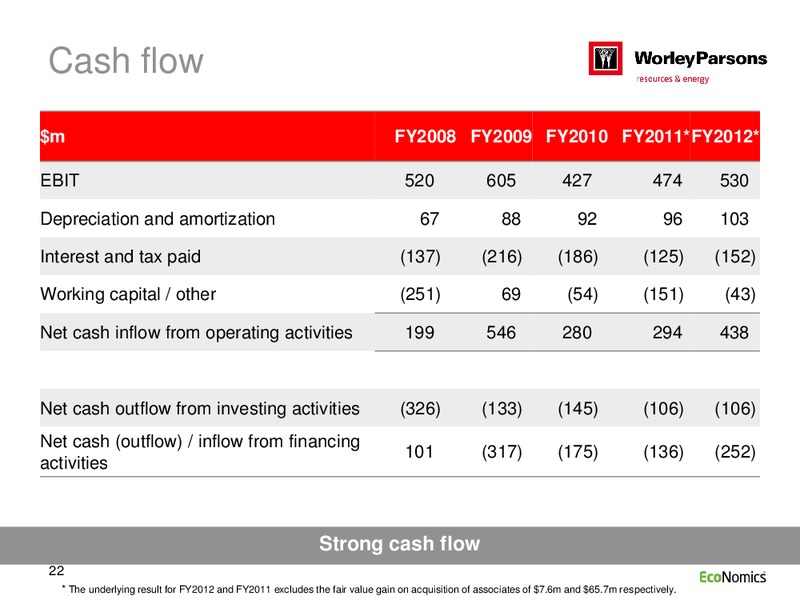
Cash flow m FY2008 FY2009 FY2010 FY2011* FY2012* EBIT 520 605 427 474 530 Depreciation and amortization 67 88 92 96 103 Interest and tax paid (137) (216) (186) (125) (152) Working capital / other (251) 69 (54) (151) (43) Net cash…
Gearing and key metrics Key Metrics FY2009 FY2010 FY2011* FY2012* Gearing ratio 26% 26% 22% 20% Facility utilisation 54% 61% 53% 51% Average cost of debt 5.5% 5.2% 5.7% 5.7% Average maturity (years) 4.1 3.8 4.6 3.8 Interest…
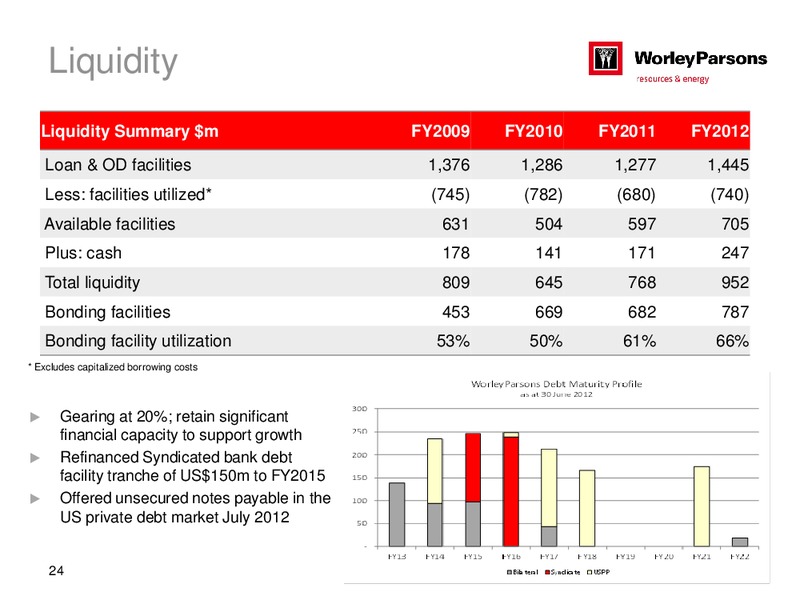
Liquidity Liquidity Summary Liquidity mto support growth available FY2009 FY2010 FY2011 FY2012 Loan & OD facilities 1,376 1,286 1,277 1,445 Less: facilities utilized* (745) (782) (680) (740) Available facilities 631 504 597 705…
Financial reporting microsite We have introduced a microsite for presentation of our FY2012 Annual Report The site provides the financial results and documents in one place, making it easier for shareholders and potential investors…
Sector outlook 2012 John Grill
Hydrocarbons FY2012 vs. FY2011 Increase in gas monetisation and petrochemical projects in the USA Aggregated as a result of lower natural gas 5,015.1 m 24.0% revenue prices % of Group High LNG prices in Asia creating 68.0% -…
Key project awards Hydrocarbons SORESCO Moin refinery expansion project, Costa Rica PetroEcuador Refineria del Pacifico refining and petrochemical complex project, Ecuador ExxonMobil Point Thomson initial production system, Alaska…
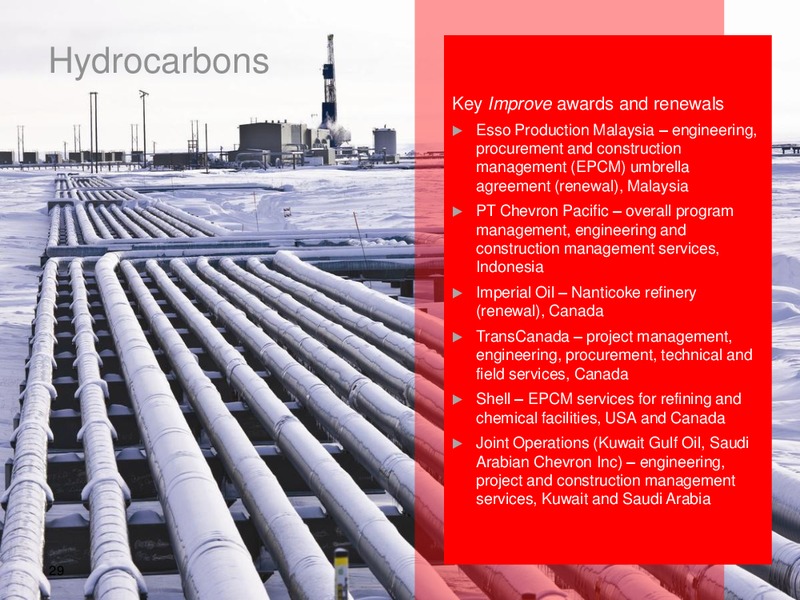
Hydrocarbons Key Improve awards and renewals Esso Production Malaysia engineering, procurement and construction management (EPCM) umbrella agreement (renewal), Malaysia PT Chevron Pacific overall program management, engineering…
Hydrocarbons Sector outlook Continued high level of spending in onshore unconventional markets Continued growth in global greenfield upstream and downstream markets Ongoing growth of global Improve markets Large number of Select…
Power FY2012 vs. FY2011 Continued growth in the nuclear Improve market Aggregated 581.3 m 13.2% Expanding opportunities in power for revenue resource projects in a number of % of Group regions 8.0% 1.0% aggregated revenue Long term…
Key project awards Power Akkuyu NGS Elektrik Uretim Anonim Sirketi nuclear power plant, Turkey InterRAO UES Baltic nuclear power plant bankable feasibility study phase 2, Russia King Abdullah City for Atomic and Renewable Energy…
Power Key Improve awards and renewals Kozloduy stress tests for nuclear power facilities, Bulgaria Bruce Power sustaining projects, Canada Ontario Power Generation Darlington nuclear refurbishment, Canada Arizona Public Services…
Sector outlook Power Developing markets continue to provide opportunities in new build power generation projects Expect growth in nuclear Improve market as a result continuing safety upgrades Further growth in resource power in…
Minerals, Metals & Chemicals FY2012 vs. FY2011 Active in bulk commodities (iron ore, coal, copper and fertilizers) Aggregated 895.4 m 39.1% Renamed the division to reflect our revenue increased focus on the global % of Group…
Minerals, Metals & Key project awards Chemicals Anglo American Chagres smelter development, Chile Areva JEB mill upgrade, Canada BASF Acai / Nanjing super absorbent polymer projects, Brazil and China BHP Billiton iron ore EPCM…
Minerals, Metals & Chemicals Key Improve awards and renewals BASF North American engineering partner contract, USA and Canada BHP Billiton iron ore sustaining capital, Australia BHP Billiton Mitsubishi Alliance coal sustaining…
Minerals, Metals & Sector outlook Chemicals Current market uncertainty resulting in near term caution Uncertainty resulting in project delays and review of capital programs, particularly in Australia Medium to long term outlook…
Infrastructure & Environment FY2012 vs. FY2011 Further developed the restoration sector and secured several global Aggregated restoration framework agreements 870.8 m 24.0% revenue with global customers % of Group Redirected urban…
Infrastructure & Environment Key project awards MPX Guajira coal port and rail infrastructure, Colombia Norte Energia Belo Monte hydroelectric plant environment and social compliance, Brazil Queensland Curtis LNG water treatment…
Infrastructure & Key Select and Improve awards Environment and renewals Port of Los Angeles/Long Beach restoration services framework agreement, USA BP remediation management North American framework agreement, USA ExxonMobil…
Infrastructure & Environment Sector outlook Increasing engagement with global customers Demand for resource infrastructure continues to grow in Australia, Sub Saharan Africa and Latin America Strong demand for remediation,…
Summary Delivered good underlying earnings Continue to focus on building capability growth despite the volatile and in the developing world challenging market conditions Well positioned to meet the growing Growth continues in the…
Group outlook Commenting on the outlook for the WorleyParsons Group, Mr John Grill said: Subject to the markets for our services remaining strong, we expect to achieve good growth in FY2013 compared to FY2012 underlying earnings. We…
 Loading...