2015 HALF YEAR RESULTS ANNOUNCEMENT Half Year Ended 31 December 2014 Grant King, Managing Director Karen Moses, Executive Director, Finance and Strategy 19 February 2015
Outline 1.Performance Highlights Grant King 2.Financial Review Karen Moses 3.Operational Review Grant King 4.Prospects Grant King 5.Appendix 3
1. PERFORMANCE HIGHLIGHTS Grant King, Managing Director 4
Highlights Statutory Loss* (25m) down from 322m Statutory EPS* (2.3 cps) down from 29.3 cps Underlying Profit1* 346m down 9% Underlying EPS* 31.3 cps down 10% Group OCAT 905m down 13% Interim Dividend Unfranked 25 cps - - Total…
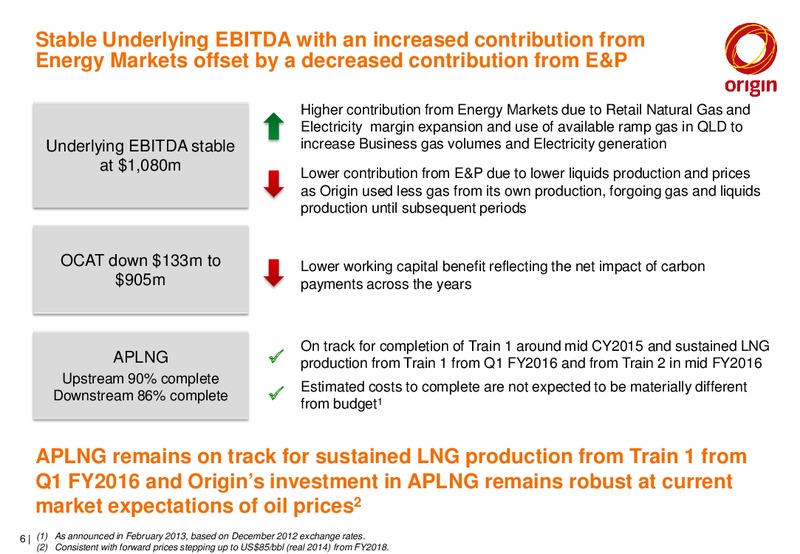
Stable Underlying EBITDA with an increased contribution from Energy Markets offset by a decreased contribution from E&P Higher contribution from Energy Markets due to Retail Natural Gas and Electricity margin expansion and use of…
Energy Markets contribution increased 112 million primarily from Retail Natural Gas and Electricity margin expansion and use of available ramp gas in QLD to increase Business gas sales and Electricity generation Energy Markets Sources…
The current period has seen a solid operational performance with significant progress on implementation of key priorities Improving returns in energy markets businesses Deregulation of retail markets Improved margin management…
As prolonged low oil prices will reduce expected growth in earnings and cash flow, Origins key priorities will be moderated to conserve cash flow and accelerate cost reductions To this end, Origin has or will: continue to limit…
Underlying EBITDA stable at 1,080 million Underlying EBIT down 5% to 659 million Underlying EBITDA Underlying EBIT ( million) HY2015 HY2014 Change HY2015 HY2014 Change Energy Markets 617 505 22% 466 372 25% Contact Energy 234 232…
Reconciliation of Statutory Profit to Underlying Profit ( million) HY2015 HY20141 Change Statutory (Loss) / Profit (25) 322 347 Items Excluded from Underlying Profit Decrease in fair value of financial instruments (279) (158) (121)…
Group OCAT decreased to 905 million Free cash flow decreased to 707 million ( million) HY2015 HY2014 Change Underlying EBITDA 1,080 1,082 (2) Net impact of carbon payments under Change in working capital 103 217 (114) the Clean…
Following funding initiatives to extend debt maturities and improve liquidity position Origin has 5.2 billion1 of committed and undrawn debt facilities and cash as at 31 December 2014 Origin Debt & Bank Guarantee Maturity Profile as…
An unfranked1 interim dividend of 25 cps has been determined, representing a payout ratio of 80% of Underlying EPS Dividends and Underlying EPS Dividends and Free Cash Flow per share 150 150 125 125 100 100 cents per…
3. OPERATIONAL REVIEW Grant King, Managing Director 17
Energy Markets EBITDA up 112 million to 617 million primarily due to expanding Natural Gas and Electricity margins and higher Natural Gas volumes Natural Gas Gross Profit up 67m due to: Energy Markets Underlying EBITDA Bridge…
Natural Gas Unit Gross Profit up 15% (0.40/GJ) as tariffs increase in line with rising East Coast market prices while underlying energy procurement costs remain flat External Volumes Sold (PJ) HY2015 HY2014 Change Retail (Consumer &…
Origins flexible portfolio and gas transportation arrangements have allowed Origin to monetise available ramp gas in Queensland, forgoing gas production until subsequent periods Energy Markets Sources and PJ Uses of Gas 120…
Origin is continuing to increase its Natural Gas penetration to benefit from expanding Natural Gas Gross Margins per customer Natural Gas Customer Accounts Natural Gas and Electricity Gross 1,100 Margin per Customer 116,000…
Electricity Gross Profit up 13% (4.10/MWh) primarily due to higher retail tariffs and stable black energy procurement costs Volumes Sold (TWh) HY2015 HY2014 Change Retail (Consumer & SME) 9.1 9.1 (0.0) Business 9.6 10.4 (0.8)…
Strong competition in VIC and increasing competition in NSW resulted in customer losses in the September Quarter following reduction in Origin discounts in July ... Origins Average Signed Discount Offers for Electricity and Natural…
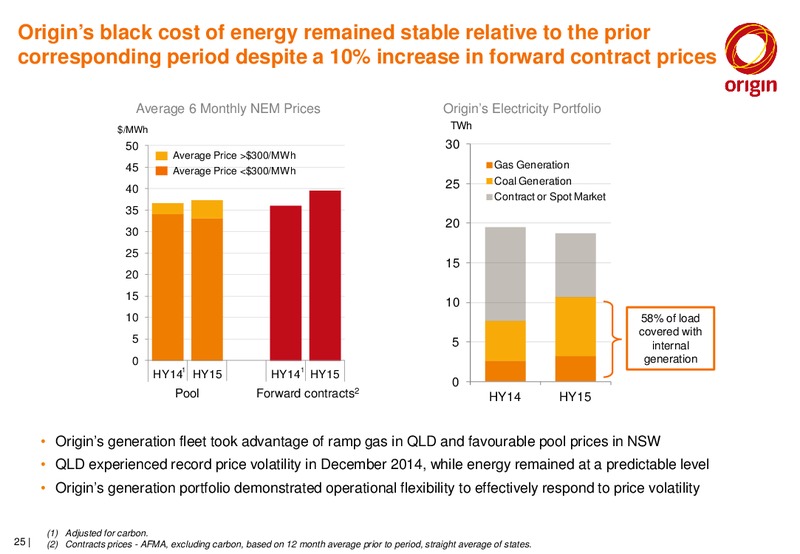
Origins black cost of energy remained stable relative to the prior corresponding period despite a 10% increase in forward contract prices Average 6 Monthly NEM Prices Origins Electricity Portfolio /MWh TWh 50 30 Average Price…
Natural Gas & Electricity cash cost to serve per customer 4 or 5% lower, reflecting improved operational efficiency and increased use of internal sales channels ... Operating costs HY2015 HY2014 Change Cash cost to serve ( per…
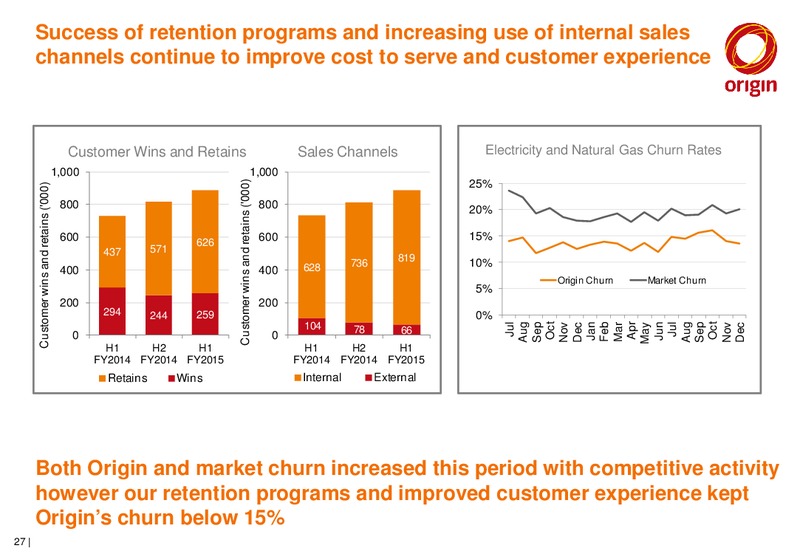
Success of retention programs and increasing use of internal sales channels continue to improve cost to serve and customer experience Customer Wins and Retains Sales Channels Electricity and Natural Gas Churn Rates 1,000 1,000…
Origin is continuously adapting processes, introducing new products and investing in technology ... Improving the contract renewal pathway Dec 13 Dec 14 Strengthening our service offering to the Small to Medium Business segment…
Through the Solar and Energy Services business Origin has an opportunity to engage more deeply with our customers... Origin has been participating in The Solar and Energy Services Origin will look to enhance the market for more than…
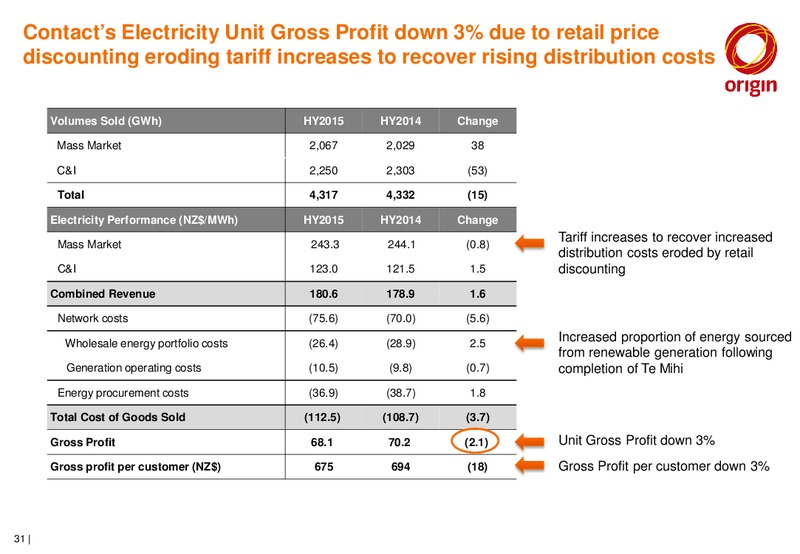
Contacts Electricity Unit Gross Profit down 3% due to retail price discounting eroding tariff increases to recover rising distribution costs Volumes Sold (GWh) HY2015 HY2014 Change Mass Market 2,067 2,029 38 C&I 2,250 2,303 (53)…
While wholesale energy portfolio costs were lower during the period following the commissioning of Te Mihi, the reduction was lower than expected due to an extended plant outage Contacts Renewable and Thermal Generation (based on…
E&P EBITDA down 94 million to 208 million primarily due to lower liquids production and prices E&P EBITDA Bridge1 Gas and Liquids Production2 PJe 60 350 24 (23) Natural Gas & Ethane (28) Liquids 300 (34) 50 (20) 250 (7) (6)…
Origins focus on offsetting natural field decline has resulted in development activities at BassGas and encouraging exploration results in Otway and Perth basins ... Bass Basin Otway Basin Perth Basin Ensign 931 rig Sapura 3000…
LNG Origins Cash Contributions (m) (m) UnderlyingEBITDA Underlying EBITDA to APLNG1 40 1,500 39 1,437 1,412 35 30 1,000 20 500 10 0 0 HY2014 HY2015 HY2014 HY2015 Substantial progress made on the project Upstream…
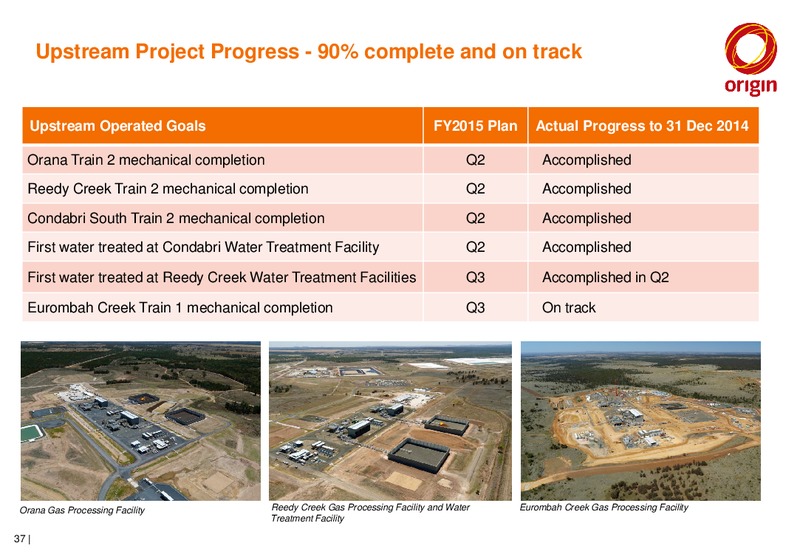
Upstream Project Progress - 90% complete and on track Upstream Operated Goals FY2015 Plan Actual Progress to 31 Dec 2014 Orana Train 2 mechanical completion Q2 Accomplished Reedy Creek Train 2 mechanical completion Q2…
Downstream Project Progress - 86% complete and on track Downstream Operated Goals FY2015 Plan Actual Progress to 31 Dec 2014 Complete loading platform for LNG jetty Q1 Accomplished Inlet Air Chiller Package received on Curtis…
APLNG capital expenditure for the period was 3.9 billion, with Origins cash contribution 1.4 billion Cumulative 6 months to (Am) from FID1 to 31 31 Dec 2014 Dec 2014 Estimated costs to complete are not Project Capex 2,8021…
The commencement of commercial LNG production is driven by downstream milestones which are progressing to plan H2 FY2015 H2 FY2015 Upstream Operated Goals Downstream Operated Goals Plan Plan Condabri North Train 2 mechanical…
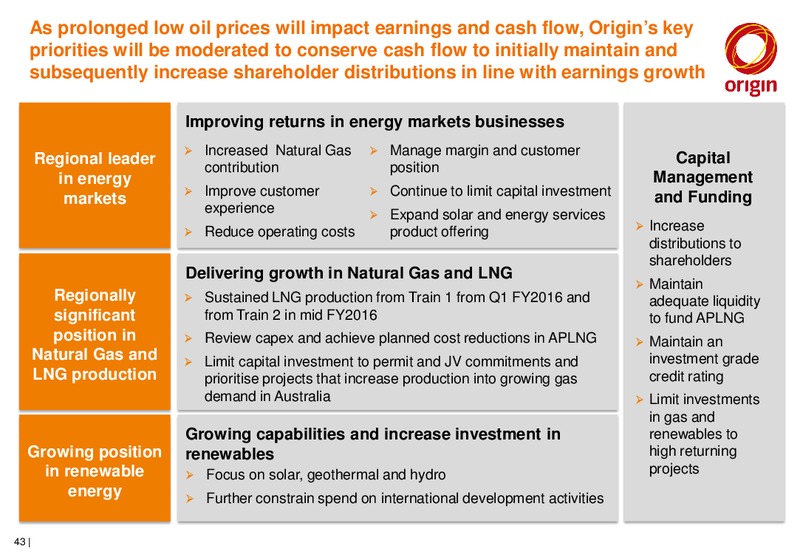
As prolonged low oil prices will impact earnings and cash flow, Origins key priorities will be moderated to conserve cash flow to initially maintain and subsequently increase shareholder distributions in line with earnings growth…
Over the next 2 to 3 years gas demand on the East Coast of Australia will be driven by ramp up in production of LNG ... 2000 H1 FY2015 H2 FY2015 FY2016 1600 Benefit from ramp Continued benefit from Continued Retail Natural Gas…
Origins fuel and generation portfolio has the flexibility to manage changing market conditions Origin Electricity Demand and Supply Average 6 monthly QLD NEM Net Supply and Demand1 6 months to 31 Dec 2014 Pool Prices TWh 120…
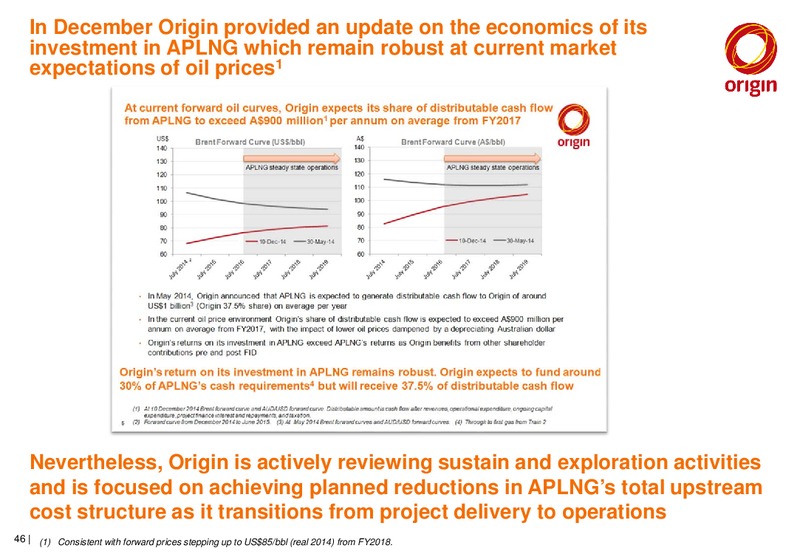
In December Origin provided an update on the economics of its investment in APLNG which remain robust at current market expectations of oil prices1 Nevertheless, Origin is actively reviewing sustain and exploration activities and…
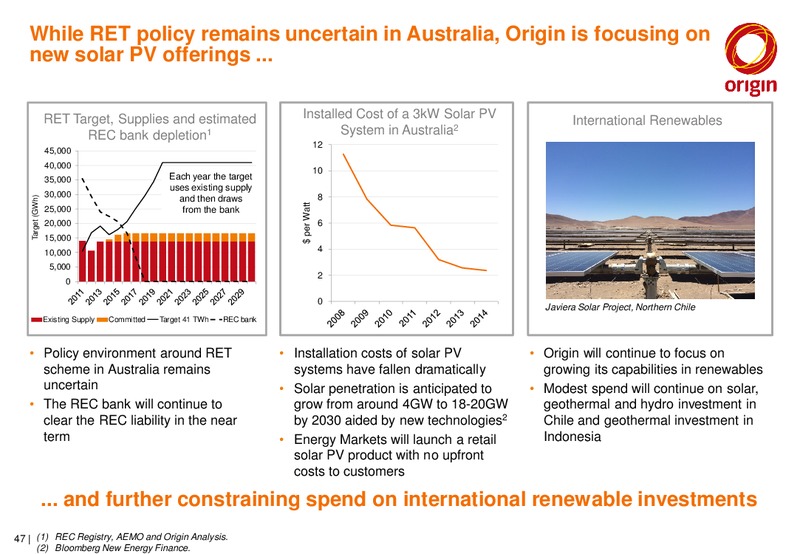
While RET policy remains uncertain in Australia, Origin is focusing on new solar PV offerings ... RET Target, Supplies and estimated Installed Cost of a 3kW Solar PV International Renewables REC bank depletion1 System in Australia2…
Origin will lower capex spend relative to prior plans, limiting investments to higher returning projects Growth Capital Expenditure by Segment and Origins Cash Contribution to APLNG1,2 5,000 E&P capex focused on increasing gas…
Origins liquidity position remains strong, with 5.2 billion1 of committed and undrawn debt facilities and cash sufficient to fund remaining commitments to APLNG until the project is self funding Given the potential for lower oil…
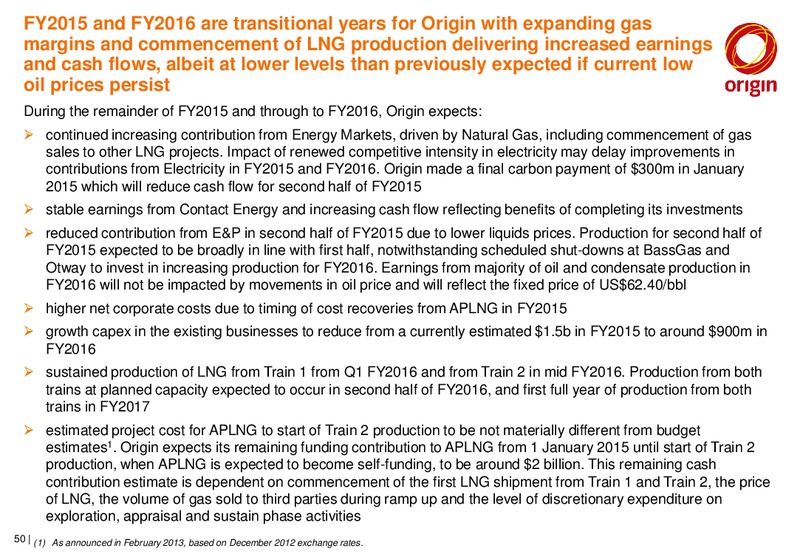
FY2015 and FY2016 are transitional years for Origin with expanding gas margins and commencement of LNG production delivering increased earnings and cash flows, albeit at lower levels than previously expected if current low oil prices…
5. APPENDIX 51
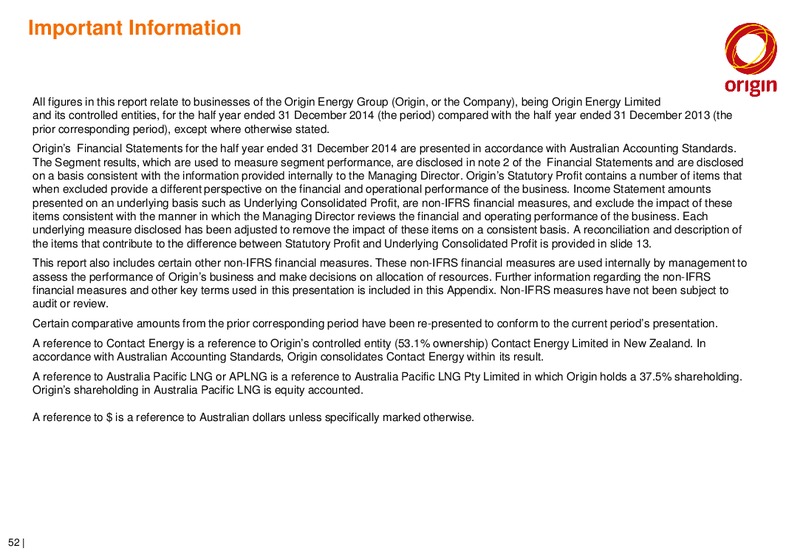
Important Information All figures in this report relate to businesses of the Origin Energy Group (Origin, or the Company), being Origin Energy Limited and its controlled entities, for the half year ended 31 December 2014 (the period)…
Glossary - Statutory Financial Measures Statutory Financial Measures are measures included in the Financial Statements for the Origin Consolidated Group, which are measured and disclosed in accordance with applicable Australian…
Glossary - Non-IFRS Financial Measures Non-IFRS Financial measures are defined as financial measures that are presented other than in accordance with all relevant Accounting Standards. Non-IFRS Financial measures are used internally by…
Glossary - Non-Financial Terms Term Meaning Proved Reserves are those reserves which analysis of geological and engineering data can be estimated with reasonable certainty to be 1P reserves commercially recoverable. There should be…
Additional APLNG Slide 57
APLNG economics remain robust in current oil price environment Consistent with prior guidance, APLNGs underlying economics are based on the following assumptions on project cash costs during steady state operations: Volumes 8.6 mtpa…
THANK YOU For more information Chau Le Group Manager, Investor Relations Email: chau.leoriginenergy.com.au Office: +61 2 9375 5816 Mobile: + 61 467 799 642 www.originenergy.com.au 59
 Loading...