Presentation for investors and shareholders for 2014 05.03.2015 Novi Sad Investor Relations
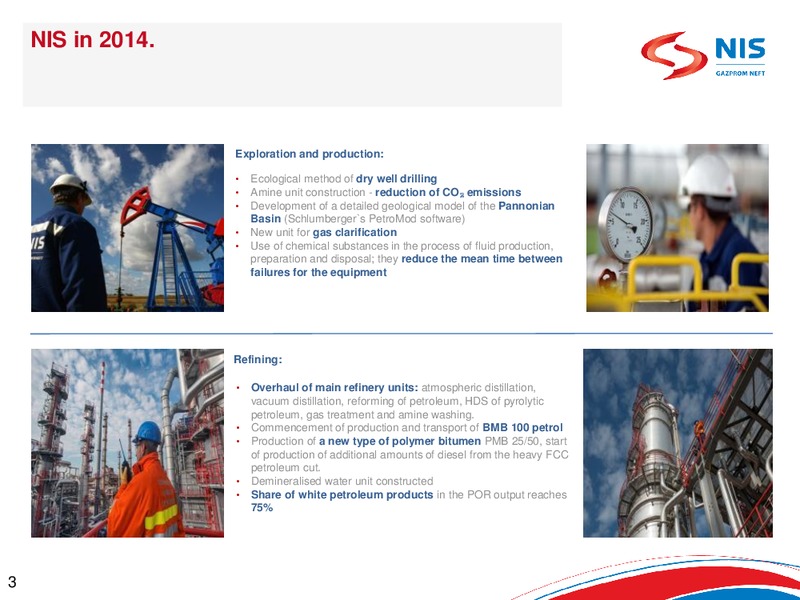
NIS in 2014. Exploration and production: Ecological method of dry well drilling Amine unit construction - reduction of CO emissions Development of a detailed geological model of the Pannonian Basin (Schlumbergers PetroMod…
NIS in 2014 Sales: The financial results of the Block improved by 138% in comparison to 2013 Beginning of sales of the new type of fuel - ULTRA D, premium Euro Diesel, at the stations of NIS Petrol, new restaurant brand…
Macroeconomic indicators Last year was rather difficult for the economy in the whole Balkan region, and it applies to NIS as well USD/RSD exchange rate Urals oil price, /bbl 2013 2014 2013 2014 101 130 98 115 95 92 100 89 86…
Challenging year for the whole industry Net profit CAPEX EBITDA -84% -7% -21% 2013. 2014. 2013. 2014. 2013. 2014. -11% -21% -13% 2013. 2014. 2013. 2014. 2013. 2014. -65% -33% -59% 2013. 2014. 2013. 2014. 2013.…
Macroeconomic conditions are similar to those in 2008, while NIS shows much higher financial stability in 2014 USD/RSD exchage rate -6% -1% +26% 0% +5% +9% USD/RSD exchange rate shows a growth tendency in both years 64.6 96.3…
Operational efficiency Application of operative efficiency increase measures has resulted in saving which is doubled as compared to projections Application of operative efficiency increase measures in 2014 resulted in the savings…
2014: HSE indices Most HSE indicators are at the projected level, except for LTIF and perforation coefficient Investment into environmental projects, mln. USD Transparency index increase Perforation coefficient Plan 7 Major…
Market of motor fuels trends 2014/2013 Regional motor fuel market in the region slightly recovered. Hungary Romania Key factor for recovering the Slovenia regional market demand for +5.4% -2.0% motor fuels calls for -0,1%…
Regional Retail Market and Motor Fuel Market Trends BOSNIA AND HERZEGOVINA BULGARIA ROMANIA 35 7% 7.3% 35 2.8% 2.6% 18 0.4% 0.5% Step-by-step market recovery Motor fuel market is recovering more Motor fuel market reported no…
The Market of the Republic of Serbia The total consumption of petroleum products is dropping The market scope of the Republic of Serbia Retail market in Republic of Serbia**, in thousands of tons in thousand tons -2.4% 0.3% 2,466…
Exploration and production Domestic oil and gas production , Domestic oil production, Oil production in Angola, in thousand conditional tons in thousand tons in thousand tons 2014 1,596 -3% 2014 1,148 -4% 2014 57 4% 2013 1,642…
Sales Oil derivatives sales, Sales structure per oil derivatives , in thousand tons in thousand tons 2014 643 1,781 157 509 3,090 0.4% 2014 700 2,390 3,090 0.4% Retail Serbia Wholesale Serbia 2013 674 1,822 84497 3,079 2013 666…
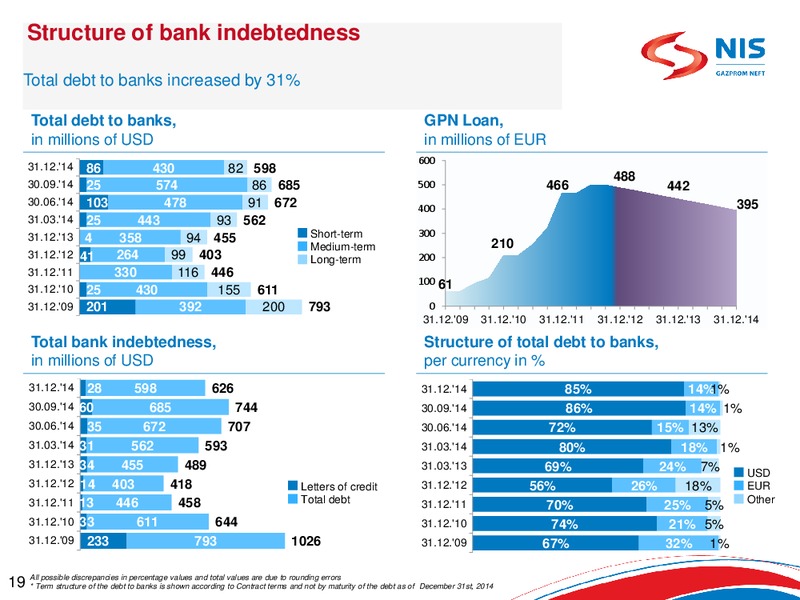
Structure of bank indebtedness Total debt to banks increased by 31% Total debt to banks, GPN Loan, in millions of USD in millions of EUR 600 31.12.'14 86 430 82 598 488 30.09.'14 25 574 86 685 500 466 442 30.06.'14 103 478 91…
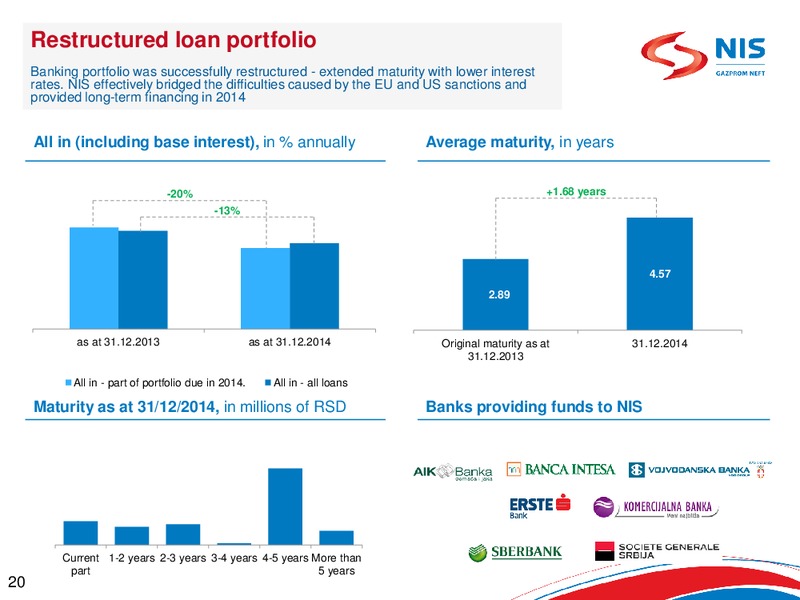
Restructured loan portfolio Banking portfolio was successfully restructured - extended maturity with lower interest rates. NIS effectively bridged the difficulties caused by the EU and US sanctions and provided long-term financing in…
Investments RSD 39.4 billion was allocated in 2014 Q4 2013. Q4 2014. Sources of investment funding 2014. 2013. 0.71 0.23 Ecology 0.99 2.07 0.07 0.14 Angola PSA* 0.30 0.60 11.83 8.10 Projects with direct economic effect 26.35…
The most important investments in Exploration and Production, Refining and Sales and Distribution 2014 Exploration and production 25.2 billion RSD Well drilling Seismic testing 3D seismic testing and exploration well…
Comparative analysis (benchmarking) of basic indicators with competitors (NIS * 2014., other I-IX 2014) EBITDA margin (in %) EBITDA/FTE** (in thousands USD) Daily sales rate (in ton/day) 10.0 2 32.8 3 5.2 5 11.9 57.3 5.8 12.7…
+ EBITDA above the plan + Efficiency increase measures + Growth in refining volume and turnover + Introduction of new products - Drop in oil and gas production - Retail sales drop - Lower OCF and the relevant increase of…
Anti-crisis plan Challenges remain in 2015. NIS has adopted a plan of anti-crisis measures; the achieved savings will be invested in the development and stability of NIS Investments - focus on the key projects for the development…
NIS a.d. Novi Sad Investor Relations Narodnog fronta 12 21000 Novi Sad, Serbia e-mail: Investor.Relationsnis.eu
 Loading...