Overview FY2014 Strong operating cash flow Earnings in line with guidance Business reorganization completed Further reduction of 1,200 overhead roles Strong operating cash flow result Final dividend of 51.0 cents per share Total…
Financial snapshot Aggregated revenue1 of 7,364m, down 3%2 Underlying NPAT 3 of 263m, down 18%2 Improvement in Group EBIT margin in second half Operating cash flow up 24% to 550m Costs associated with restructuring amounted to…
OneWayTM to Zero Harm Performance remains good Total Recordable Case Frequency Rate (TRCFR) for FY2014 was 0.10 (FY2013: 0.13) We continue a number of programs across the Group including: Board and Executive Committee structured HSE…
Our Group Strategy To enhance and leverage our broad and deep technical capabilities and our diverse geographic presence 5
Horizon 1 Getting better at what we do 6
Horizon 2 Growth from the core Hydrocarbons Australian market contracted across FY2014 as the wave of LNG projects and the associated upstream developments approached start-up phase The next wave of global LNG capacity in North…
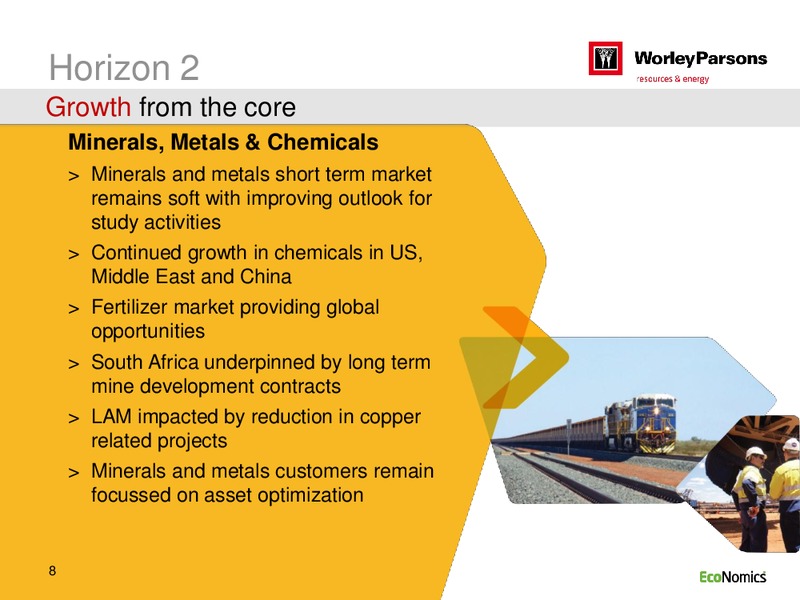
Horizon 2 Growth from the core Minerals, Metals & Chemicals Minerals and metals short term market remains soft with improving outlook for study activities Continued growth in chemicals in US, Middle East and China Fertilizer market…
Horizon 2 Growth from the core Infrastructure Resource infrastructure is in decline Cancellation of a nuclear project, but improving outlook Positive outlook in North America for water and environment services to unconventional oil…
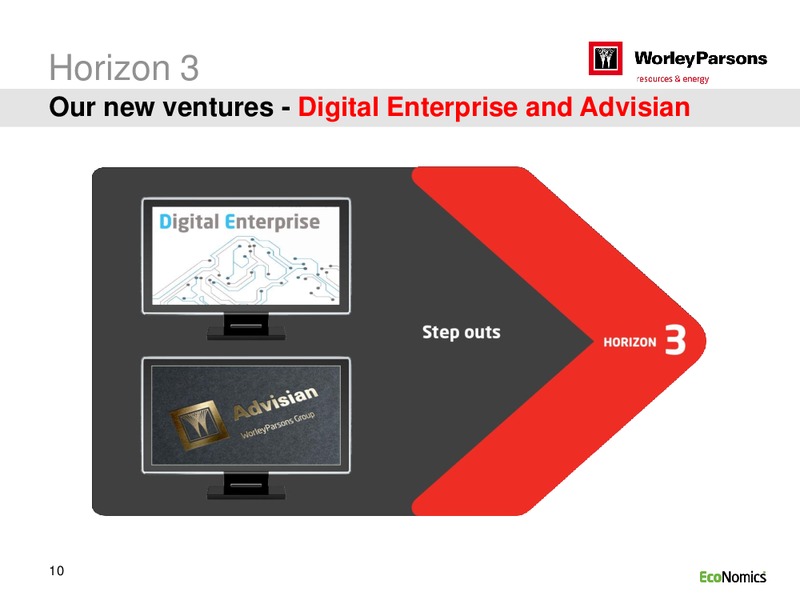
Horizon 3 Our new ventures - Digital Enterprise and Advisian 10
Total revenue by region North America region grows, Australia in decline FY2014 Total Revenue 9,583m FY2013 Total Revenue 8,832m SSA ASCHI SSA 2% 5% 3% ASCHI 5% MENA ANZ LAM MENA 15% 12% 5% 14% ANZ LAM 17% 3% EUR 9% EUR 12%…
Underlying NPAT (m) Reflects changes in contribution to EBIT at constant currency (69.7) (18.4) 27.7 (47.0) 30.3 (6.0) 5.0 19.4 322.1 263.4 17
Hydrocarbons FY2014 FY2013 Segment margin holding up Aggregated revenue m 5,371.5 5,492.9 Project activity declining in Professional services m 4,255.1 4,393.1 ANZ, ASCHI and MENA Construction and fabrication m 888.7 847.7 USAC &…
Minerals, Metals & Chemicals FY2014 FY2013 2H margin improvement Aggregated revenue m 1,065.9 1,096.5 ANZ downturn due to reduced Professional services m 1,042.4 1,085.2 project activity TWP adding to SSA result Procurement revenue…
Infrastructure FY2014 FY2013 ANZ includes FY2013 non- Aggregated revenue m 926.3 1,037.6 recurring benefit Professional services m 869.3 967.8 Cancellation of nuclear Procurement revenue with margin m 52.4 57.1 project and general…
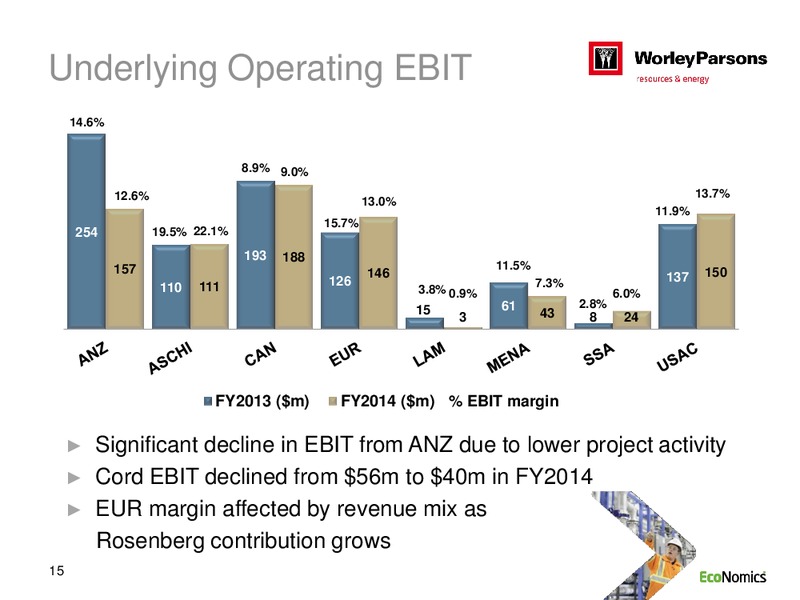
Margin profile Group Underlying EBIT Margin % 8.6% Highest second half margin for 8.0% 7.2% 6.9% three years 6.1% 9.0% Full year margin down 0.8% 9.4% 7.1% 7.3% Margins holding up in 7.6% Hydrocarbons 8.2% 7.3% Construction…
Cash flow Strong cash flow generation m FY2014 FY2013 Underlying EBIT 452 527 Depreciation and amortization 110 102 Interest and tax paid (140) (192) Working capital/other 128 7 Net cash inflow from operating activities 550…
Gearing metrics Gearing below target range FY2014 FY2013 Gearing ratio % 20% 25% Facility utilization1 % 50% 56% Average cost of debt % 5.4% 5.5% Average maturity (years) 4.2 3.8 Interest cover1 (times) 8.3x 10.6x Net debt m…
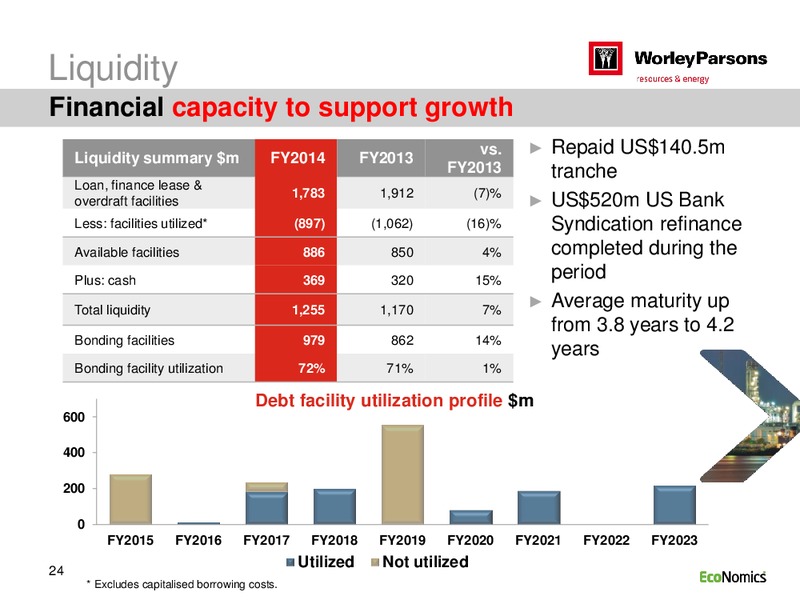
Liquidity Financial capacity to support growth vs. Repaid US140.5m Liquidity summary m FY2014 FY2013 FY2013 tranche Loan, finance lease & 1,783 1,912 (7)% overdraft facilities US520m US Bank Less: facilities utilized* (897) (1,062)…
Full year results 2014 Andrew Wood
Summary Responding to market conditions and our customers What we promised What we delivered Underlying NPAT of Underlying NPAT of 260m 300m net of 263.4m restructuring costs Reorganization charge Reorganization charge of estimated…
Group outlook Commenting on the outlook for the WorleyParsons Group, Mr Andrew Wood said: We have taken decisive action to improve margins and ensure the business is responding to market conditions and our customers needs. We are…
Q&A Full year results 2014
Supplementary information Full year results 2014
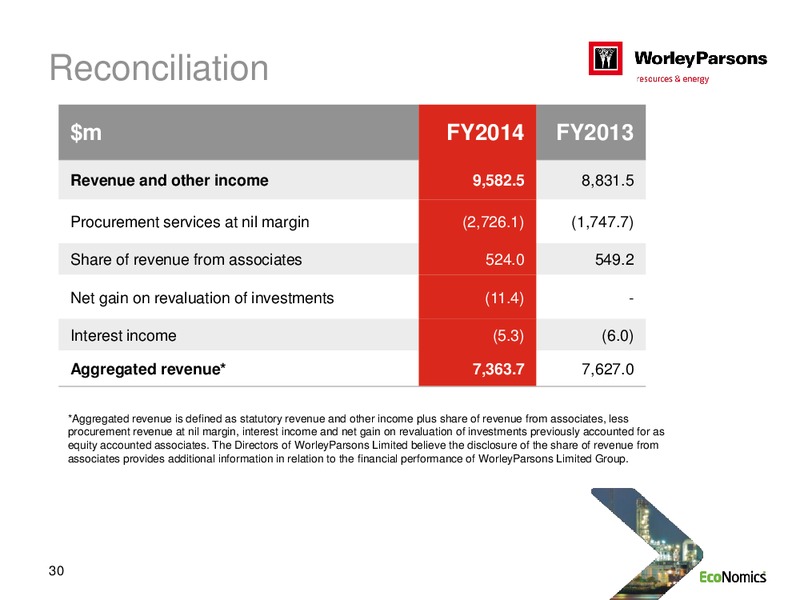
Reconciliation m FY2014 FY2013 Revenue and other income 9,582.5 8,831.5 Procurement services at nil margin (2,726.1) (1,747.7) Share of revenue from associates 524.0 549.2 Net gain on revaluation of investments (11.4) -…
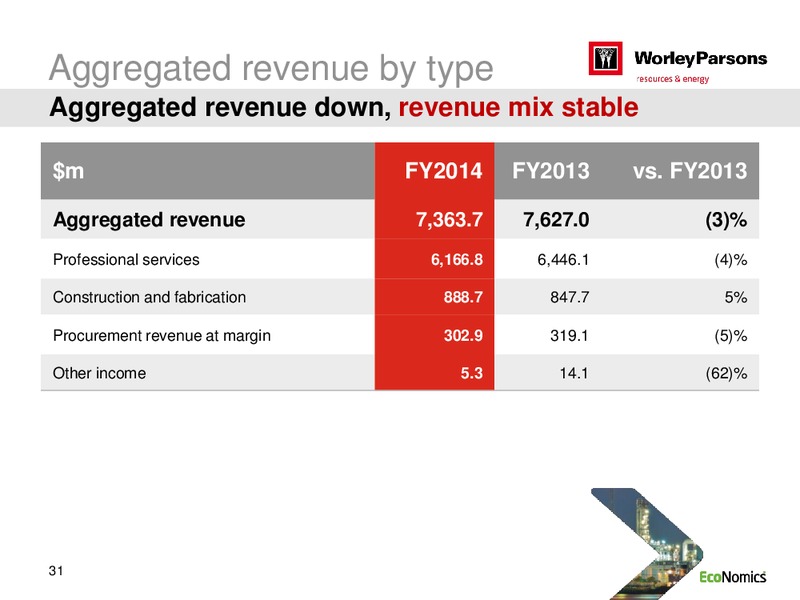
Aggregated revenue by type Aggregated revenue down, revenue mix stable m FY2014 FY2013 vs. FY2013 Aggregated revenue 7,363.7 7,627.0 (3)% Professional services 6,166.8 6,446.1 (4)% Construction and fabrication 888.7 847.7 5%…
Reconciliation m FY2014 FY2013 EBIT 428.2 527.0 Less net gain on revaluation of investments previously accounted for as equity accounted associates (11.4) - Plus restructuring costs 35.4 - Underlying EBIT 452.2 527.0 NPAT…
Dividend history Final dividend of 51.0 cents per share FY2010 FY2011 FY2012 FY2013 FY2014 Interim dividend (cps) 35.5 36.0 40.0 41.5 34.0 Franked % 100% 100% 79% 100% 25% m total 87.0 88.6 98.3 102.4 83.9 Final dividend (cps) 40.0…
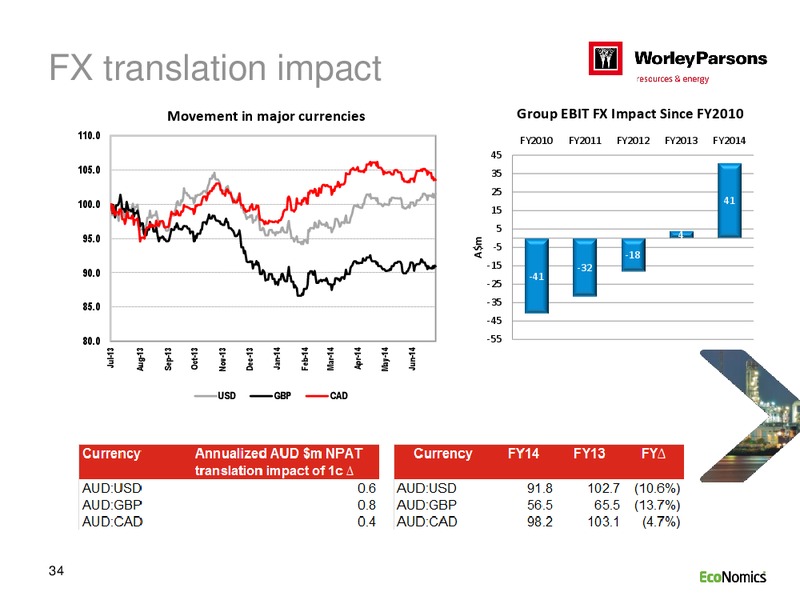
FX translation impact Movement in major currencies Group EBIT FX Impact Since FY2010 110.0 FY2010 FY2011 FY2012 FY2013 FY2014 45 105.0 35 25 100.0 41 15 5 95.0 4 Am -5 -18 -15 -32 90.0 -41 -25 85.0 -35 -45 80.0 -55…
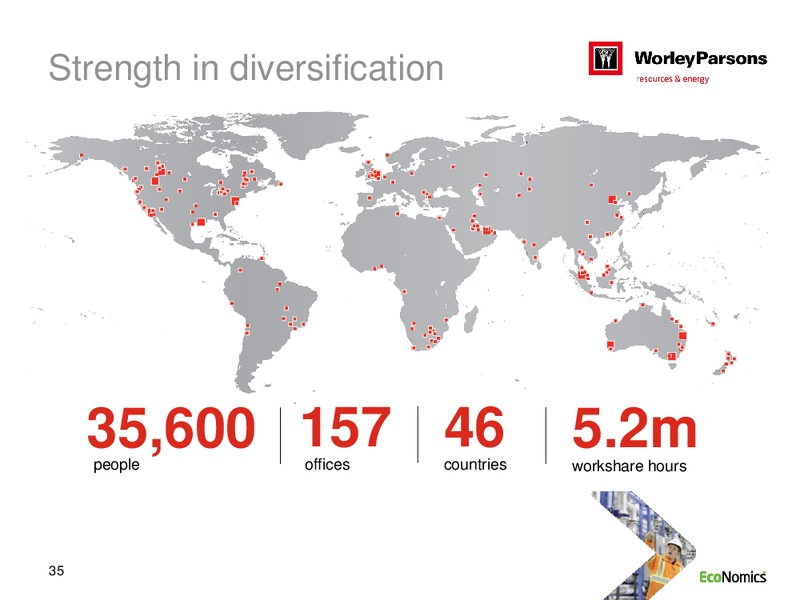
Strength in diversification 35,600 157 46 people offices countries 5.2m workshare hours 35
Diversification in earnings Top 10 customers deliver 33% of the gross margin Top 10 projects deliver 15% of the gross margin Top 10 locations deliver 71% of the operating EBIT 36
Significant awards 42 23 90 25 37
Contractual acronyms CY Calendar year EDS Engineering and Design Services E&P Engineering and Procurement EPC Engineering, Procurement and Construction EPCM Engineering, Procurement and Construction Management ESA Engineering Services…
 Loading...