Executive Summary Q4 2013 earnings of 0.35 per diluted share compared to 0.42 per diluted share in Q3 2013 o Q3 included a 15.6 million gain on the sale of the Express and an 8.6 million loss on the early extinguishment of debt; both…
Executive Summary Balance sheet Cash and cash equivalents totaled 478 million at 12/31/2013 Liquidity* of 1.1 billion at 12/31/2013 Net debt of 88 million at 12/31/2013 See updated debt maturity profile on slide 14 We define…
Operational Highlights 8
Contracting Services ( in millions, except percentages) Quarter Ended 94% utilization for the Well Intervention 12/31/2013 12/31/2012 9/30/2013 fleet Revenues (A) Skandi Constructor mobilized for operations off the coast of West…
Contracting Services Well Intervention GOM Q4000 fully utilized during Q4 IRS no. 2 on hire for the entire quarter; working at operational rates beginning late November through the end of the Q4 Helix 534 commenced operations in the…
Contracting Services Robotics 88% long-term chartered vessel fleet utilization in Q4 69% utilization for ROVs, trenchers and ROVDrill Olympic Canyon continued operations in India at 100% utilization for the quarter REM Installer…
Contracting Services Utilization 100% 98% 94% 94% 88% 87% 84% 80% 69% 68% 62% 60% Q4 2013 Q3 2013 40% Q4 2012 20% 0% Well Intervention Vessels ROV and Trencher Support Vessels ROVs and Trenchers Seawell Olympic…
Key Balance Sheet Metrics 13
Debt Maturity Profile Total funded debt of 593 million at end of Q4 2013: Debt Instrument Profile at 12/31/2013 ( amounts in millions) 200 million Convertible Senior Notes 3.25% (A) 500 (173 million net of unamortized debt discount)…
2014 Outlook ( in millions) 2014 2013 Outlook Actual Revenues (on-going operations) 1,030 805 EBITDA 350 300 CAPEX 400 343 Earnings Per Share (A) 1.55 1.65 1.04 Revenue Split: Well Intervention 625 452 Robotics 355 333…
2014 Outlook Contracting Services backlog as of December 31, 2013 was approximately 1.8 billion; total backlog of approximately 2.0 billion including Production Facilities Utilization expected to remain strong for the well intervention…
2014 Outlook Robotics business entering 2014 with a healthy, growing backlog (14% increase in backlog from Q3 to Q4 2013) o Europe and Middle East trenching markets expected to be strong; similar to 2012 o Multi-trencher burial…
2014 Outlook Capex Total capital expenditures currently budgeted at approximately 400 million in 2014 o Growth capital of approximately 320 million, including: Approximately 160 million for the Q5000 and intervention riser system…
Non-GAAP Reconciliations 21
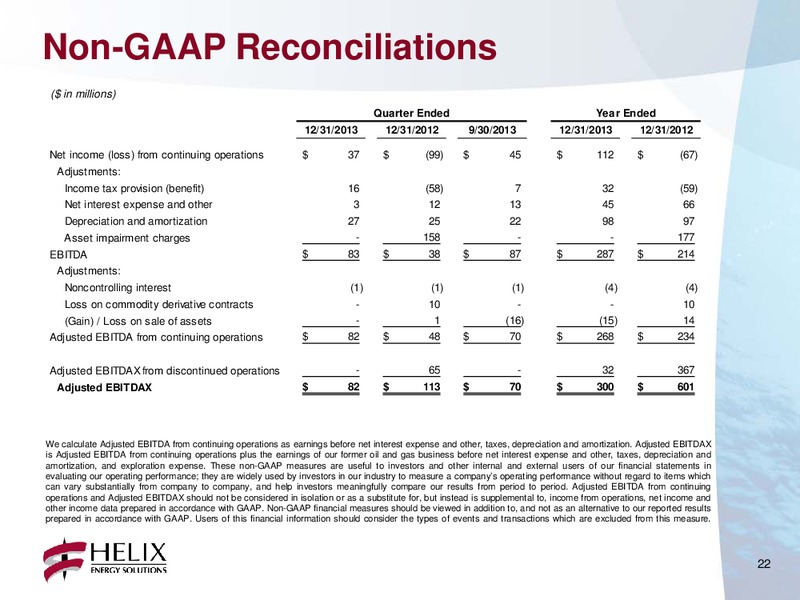
Non-GAAP Reconciliations ( in millions) Quarter Ended Year Ended 12/31/2013 12/31/2012 9/30/2013 12/31/2013 12/31/2012 Net income (loss) from continuing operations 37 (99) 45 112 (67) Adjustments: Income tax provision (benefit) 16…
Non-GAAP Reconciliations ( in millions) Reconciliation of Adjusted EBITDAX from discontinued operations: Quarter Ended Year Ended 12/31/2013 12/31/2012 9/30/2013 12/31/2013 12/31/2012 Net income (loss) from discontinued operations…
 Loading...