Financial Statements 2013 Matti Lievonen, President & CEO 4 February, 2014
Table of Contents 1 Q4/13 financials 2 Full-year 2013 highlights 3 Strategy implementation in 2013 4 Market development 5 Renewable Fuels margin 6 Current topics 7 Appendix 4 February 2014 2
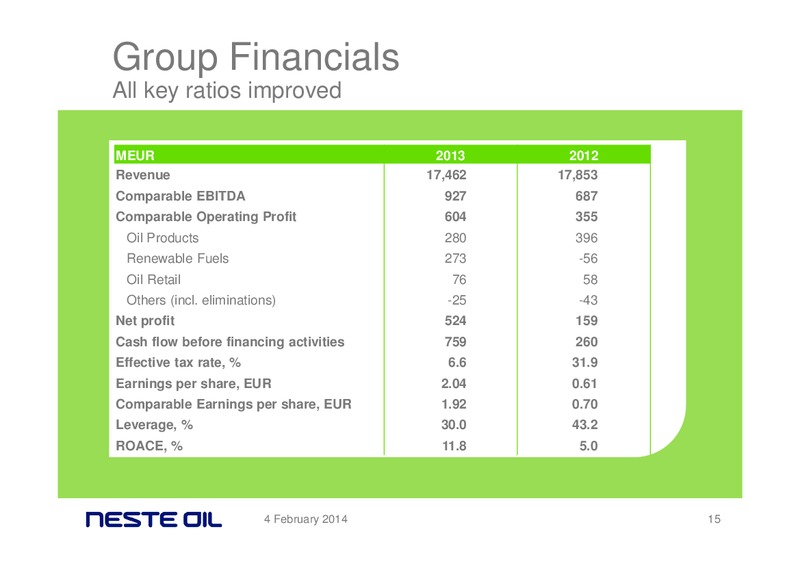
Outstanding year in 2013 Excellent full-year result with 70% increase in comparable EBIT ROACE more than doubled Outstanding Renewable Fuels performance Very strong cash flow 4 February 2014 4
Q4/13 financials
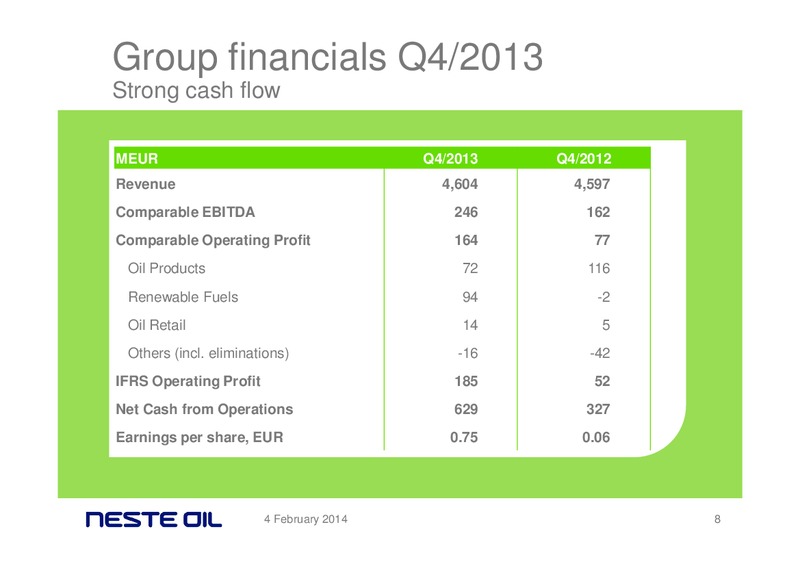
Group comparable EBIT Renewable Fuels leading over 100% improvement M 200 +26 164 150 +9 +96 100 77 -44 50 0 Q4/12 Oil Renewable Oil Retail Others Q4/13 Products Fuels 4 February 2014 6
Group financials Q4/2013 Solid performance in challenging environment 300 Comparable operating profit 250 of MEUR 164 (MEUR 77) 200 Comparable operating profit, 150 MEUR Renewable Fuels strong 100 Comparable earnings continued…
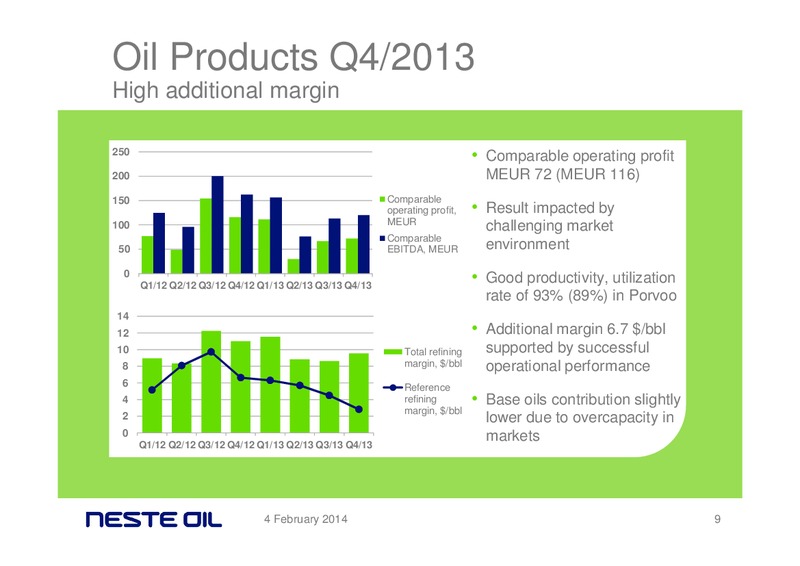
Oil Products Q4/2013 High additional margin 250 Comparable operating profit 200 MEUR 72 (MEUR 116) 150 Comparable operating profit, Result impacted by MEUR 100 challenging market Comparable 50 EBITDA, MEUR environment 0 Q1/12…
Renewable Fuels Q4/2013 Strong result in softening market 150 Strong comparable operating 100 profit at MEUR 94 (MEUR -2) Comparable operating profit, despite softening market 50 MEUR Comparable EBITDA, MEUR Record-high sales…
Oil Retail Q4/2013 Good performance continued 40 Comparable operating profit 30 MEUR 14 (MEUR 5) Comparable operating profit, 20 MEUR Higher margins continued in Comparable all market areas 10 EBITDA, MEUR Lower sales volumes…
Full-year 2013 highlights
Group comparable EBIT Outstanding year for Renewable Fuels M 700 +18 +18 604 600 +329 500 400 355 -116 300 200 100 0 2012 Oil Renewable Oil Retail Others 2013 Products Fuels 4 February 2014 13
Segment reviews First full year of operations in Renewable Fuels Oil Products Renewable Fuels Oil Retail Lower reference Sales volumes up to Strong margins and refining margin full capacity market positions in Lower Base oils…
Profitable Growth Renewable diesel sales volumes increased by over 15% and new markets were opened Base oils sales volumes grew by 14% and new customers were secured in Asia and North America Retail sales volumes in Northwest…
Productivity Singapore and Rotterdam exceeded their nameplate capacity by 10% in H2 Porvoo production line 4 diesel output exceeded 900,000 tons Oil refineries energy efficiency index hit a record high 4 February 2014 18
Renewable Feedstock Share of waste and residue feedstock grew to 52% Renewable feedstock portfolio expanded to 12 Palm oil 100% certified Neste Oil voluntary scheme for sustainability verification approved by EU 4 February…
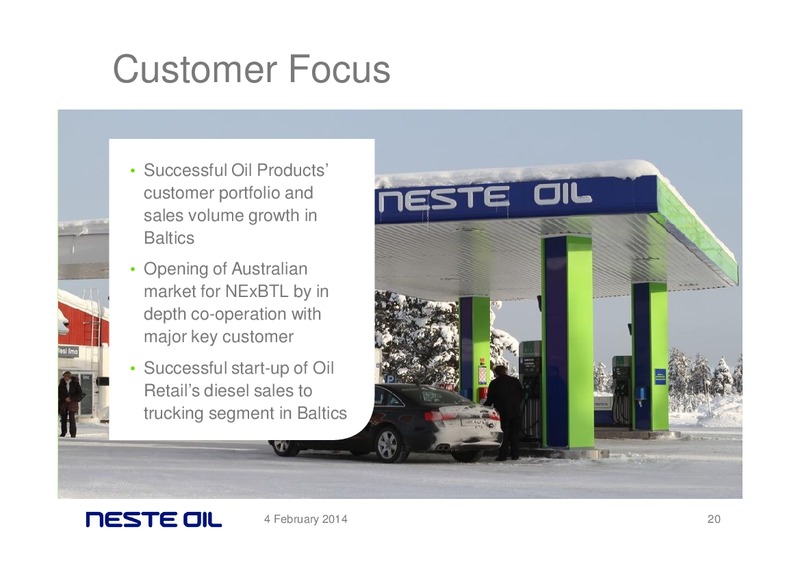
Customer Focus Successful Oil Products customer portfolio and sales volume growth in Baltics Opening of Australian market for NExBTL by in depth co-operation with major key customer Successful start-up of Oil Retails diesel…
Market development
Crude oil price development Less volatility than in 2012 Brent, /bbl Crude oil price 130 weakened towards summer due to new 120 concerns on international economy and growth prospects in China 110 trended up during late summer due to…
Margins in Oil Products Margins averaged lower than in 2012 Product margins (price differential vs. crude), /bbl 30 Gasoline margins unseasonably high in Q1 due to refinery outages 20 New capacity ramping up in Middle East and…
Drivers in Renewable Fuels margins European margin drivers trended down towards end-2013 FAME RED Seasonal vs. Palm oil price* differential, /ton 500 FAME prices quite stable during 400 2013 300 European Commission 200…
Drivers in Renewable Fuels margins North American markets softened after peak levels SME vs. Soybean oil price differential, /ton 700 High demand and prices for SME 600 and renewable diesel during 2013 500 due to ethanol blend wall…
Oil Retail market Margins improved in all markets from 2012 Strong margins particularly in Finland and Northwest Russia Stable markets in Baltic countries Slow heavy traffic effecting volumes in Finland 4 February 2014 26
Renewable Fuels margin
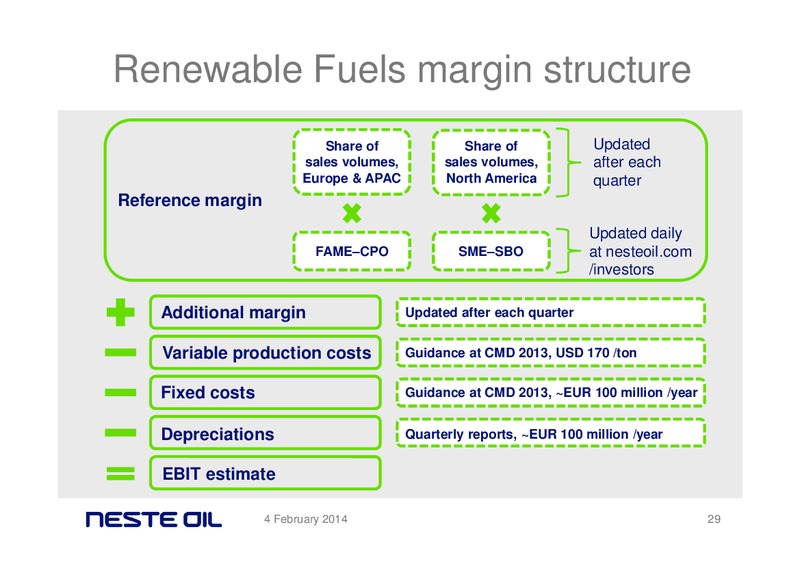
Introducing Renewable Fuels margin Moving to Group level guidance Target to improve visibility of Renewable Fuels profit drivers Renewable Fuels margin to indicate direction of result development 4 February 2014 28
Renewable Fuels margin structure Share of Share of Updated sales volumes, sales volumes, after each Europe & APAC North America quarter Reference margin Updated daily FAMECPO SMESBO at nesteoil.com /investors Additional margin…
Elements of additional margin Density escalation and energy content Quality premium Side-product revenue Hedging Maintenance shutdowns Logistics costs Actual feedstock mix 4 February 2014 30
Current topics
Company outlook for 2014 Group's full-year comparable Production line 4 at Porvoo operating profit expected to be at refinery scheduled to be shut the level of MEUR 500 in 2014 down for decoking maintenance for approx. five weeks in…
Dividend proposal Board of Directors will propose dividend of EUR 0.65 per share Yield 4.5% (at year-end 2013 share price) 34% of comparable net profit 4 February 2014 33
We focus on Renewable Refinery Fuels Safety Cash flow productivity markets and customers 4 February 2014 34
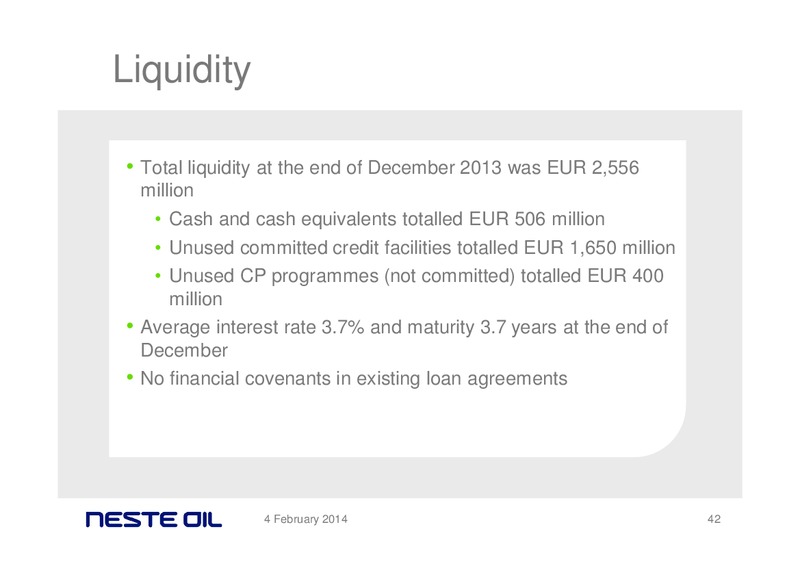
Liquidity Total liquidity at the end of December 2013 was EUR 2,556 million Cash and cash equivalents totalled EUR 506 million Unused committed credit facilities totalled EUR 1,650 million Unused CP programmes (not committed)…
 Loading...