First Quarter result 2014 Matti Lievonen, President & CEO 25 April 2014
Table of Contents 1 Q1/14 Group financials 2 Q1/14 segment reviews 3 Current topics 4 Appendix 25 April 2014 2
Q1/14 Group financials
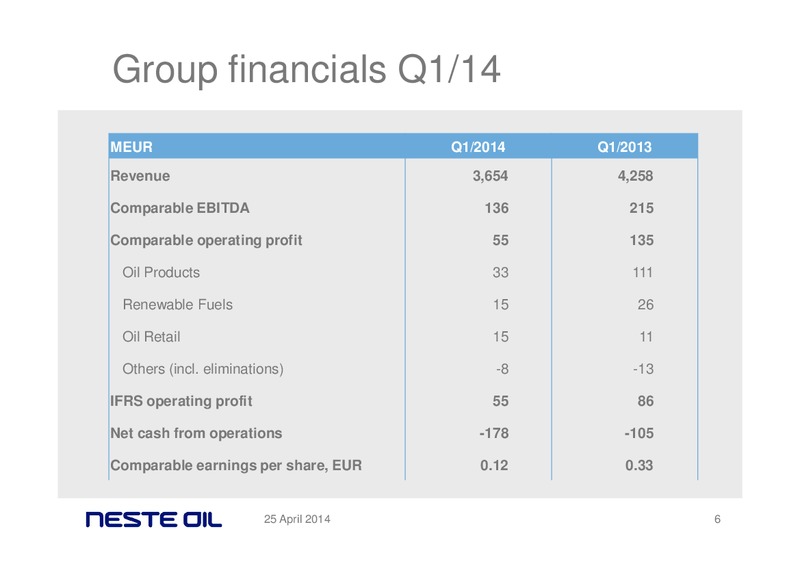
Satisfactory performance in weak market Good operational performance delivered high additional margins Weak reference margins in both Oil Products and Renewable Fuels Lower fixed costs 25 April 2014 5
Low reference margin Oil Products comparable EBIT Q1/13 vs. Q1/14, MEUR 111 -4 -56 -9 +2 -11 33 Q1/13 Volumes Reference Additional Fixed costs Other Q1/14 margin margin 25 April 2014 14
Renewable Fuels impacted by weak markets Comparable EBIT, MEUR 150 Weak margins particularly in the US 100 Good operational performance at 106% 50 utilization rate 0 27% of sales volumes to Q1/13 Q2/13 Q3/13 Q4/13 Q1/14 North…
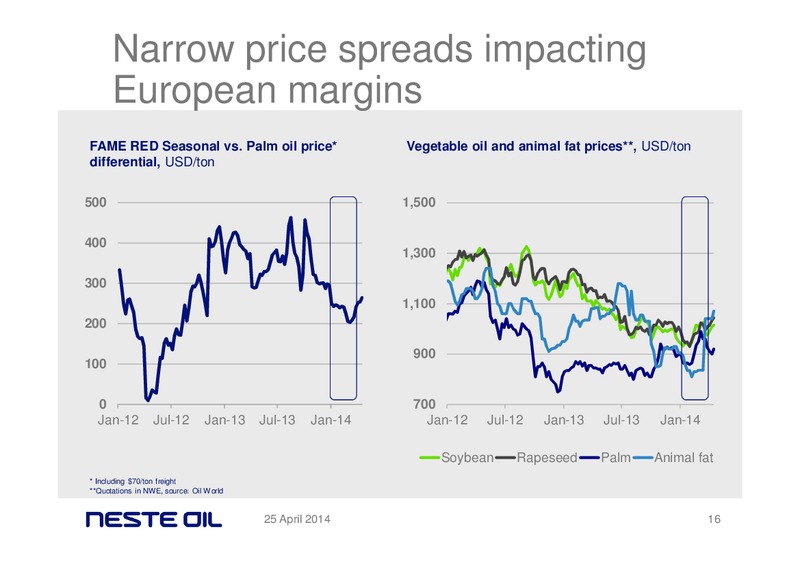
Narrow price spreads impacting European margins FAME RED Seasonal vs. Palm oil price* Vegetable oil and animal fat prices**, USD/ton differential, USD/ton 500 1,500 400 1,300 300 1,100 200 900 100 0 700 Jan-12 Jul-12 Jan-13…
North American market waiting for regulatory decisions SME vs. Soybean oil price differential, USD/ton Biodiesel RIN, US cent /gal 800 150 600 100 400 50 200 0 0 Jan-12 Jul-12 Jan-13 Jul-13 Jan-14 Jan-12 Jul-12 Jan-13 Jul-13…
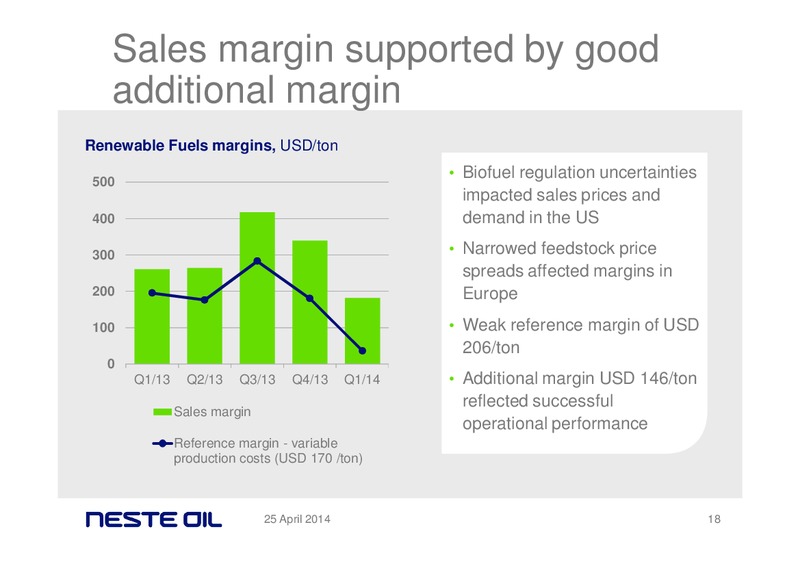
Sales margin supported by good additional margin Renewable Fuels margins, USD/ton Biofuel regulation uncertainties 500 impacted sales prices and 400 demand in the US 300 Narrowed feedstock price spreads affected margins in 200…
Sales volumes and additional margin compensated weak markets Renewable Fuels comparable EBIT Q1/13 vs. Q1/14, MEUR +14 -47 26 +22 -1 +1 15 Q1/13 Volumes Reference Additional Fixed costs Other Q1/14 margin margin 25…
Drop in reference margin impacted earnings Renewable Fuels comparable EBIT Q4/13 vs. Q1/14, MEUR 94 -15 -63 -6 +6 -1 15 Q4/13 Volumes Reference Additional Fixed costs Other Q1/14 margin margin 25 April 2014 20
Oil Retails solid performance continued Comparable EBIT, MEUR 30 Stronger margins in all markets 20 Divestments of businesses in Poland 10 and Sweden improved result 0 Q1/13 Q2/13 Q3/13 Q4/13 Q1/14 Restructuring of station…
Stronger margins in all markets Mild winter impacting heating oil demand in Finland Modest growth in car traffic in Finland Growing demand in Russia and Baltic countries Fuel branding: Neste Futura introduced in Baltic…
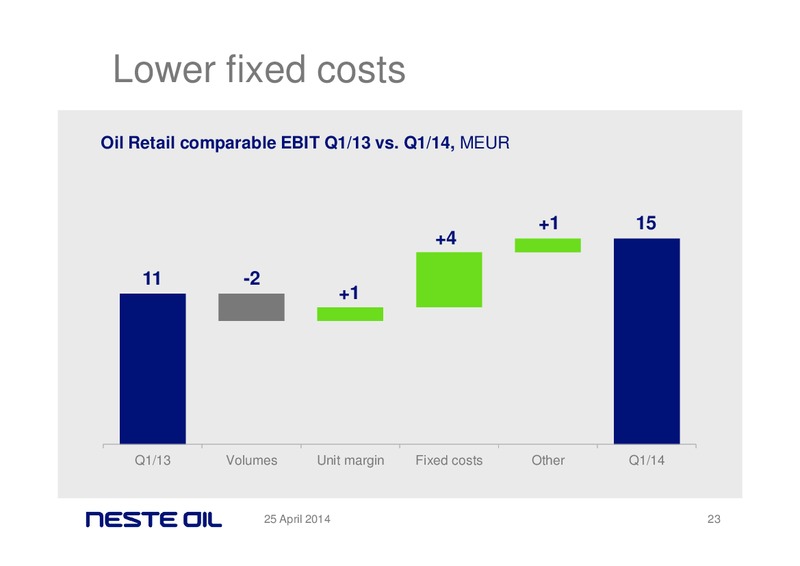
Lower fixed costs Oil Retail comparable EBIT Q1/13 vs. Q1/14, MEUR +1 15 +4 11 -2 +1 Q1/13 Volumes Unit margin Fixed costs Other Q1/14 25 April 2014 23
Current topics
Company outlook for 2014 revised Q1 refining and renewable fuels Singapore NEXBTL refinery to be margins softer than expected taken down for eight-week major turnaround during Q3 and Q4 Group's full-year comparable operating profit…
CMD Save the date Neste Oil will host a Capital Markets Day in London on 11 September 2014 Invitations will follow 25 April 2014 26
We focus on Renewable Refinery Fuels Safety Cash flow productivity markets and customers 25 April 2014 27
Cash flow MEUR Q1/14 Q1/13 Q4/13 2013 Profit before taxes 38 65 167 561 Adjustments total 101 126 101 360 Change in working capital -287 -272 386 100 Cash from operations -148 -81 654 1,021 Net finance costs -10 -1 -13 -98 Taxes -20 -23…
Liquidity & maturity profile MEUR 600 Total liquidity at the end of March 2014 was EUR 2,130 million 500 Cash and cash equivalents totalled 400 EUR 168 million Unused committed credit facilities 300 totalled EUR 1,582 million 200…
 Loading...