Headlines Modest net profit growth of 3%; strong growth in EBITDA of 17% Record year-end backlog of US15.0 billion US3.0bn of new awards in the year to date, which, together with our opening backlog, gives good revenue visibility…
ECOM Key contract awards ECOM order intake for 2013 totalled US7.8 billion Upper Zakum, Abu Dhabi US2.9bn EPC contract awarded to Petrofac Emirates Onshore Engineering & Bab Gas Compression and Bab Habshan Projects, Abu Dhabi EPC…
ECOM Update on major projects We have successfully handed over 4 multi-billion dollar projects during 2013 with a gross value of approximately Onshore Engineering & Construction US10 billion Asab field development, Abu…
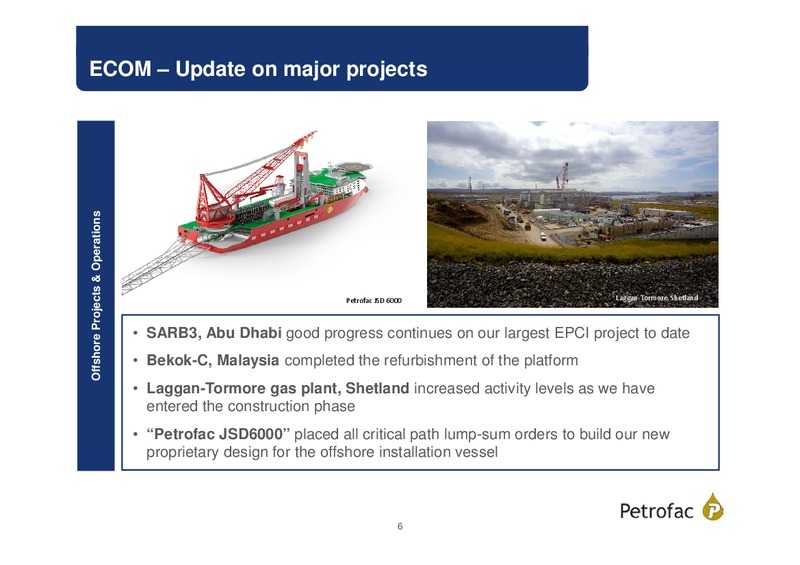
ECOM Update on major projects Picture of Laggan Tormore Offshore Projects & Operations Petrofac JSD 6000 Laggan-Tormore, Shetland SARB3, Abu Dhabi good progress continues on our largest EPCI project to date Bekok-C, Malaysia…
ECOM New business prospects Predominantly exposed to NOC capex Strong OEC bidding pipeline in 2014 with and IOC opex prospects totalling c. US50bn US3bn of new awards in the year to Strong OPO bidding pipeline in 2014 with date;…
IES Key contract awards and developments Together with Taleveras, signed a 5- year MOU with NPDC to explore opportunities in Nigeria and a 20-year agreement to develop further NPDCs offshore block OML119 Integrated Energy…
IES Update on major projects Equity Upstream Investments Block PM304 commenced production on West Desaru 18 months from approval of Field Development Programme (FDP) FPF1 - completed dry dock marine system refurbishment and hull…
IES New business prospects North Sea East Europe Caspian SE Asia Middle East and Mexico North Africa West Africa New interest from explorers 10
Income Statement USm 2013 2012 Variance Revenue 6,329 6,240 1% Operating profit * 793 758 5% Profit before tax 789 765 3% Income tax expense (142) (135) 5% Profit for the year 647 630 3% Profit attributable to Petrofac 650 632…
2013 year-end backlog Backlog increased 27% to end the year at the record level of US15.0bn OEC backlog increased 50% over the year to US7.8bn (Dec 2012: US5.1bn) reflecting awards in Abu Dhabi, Algeria and Oman further US2.9bn of…
Cash flow and gross cash balances Net debt stood at US727m at 31 December 2013 reflecting: working capital outflows of US893m predominantly due to an increase in WIP of US817m an increase in long-term receivable from a customer of…
Onshore Engineering & Construction Revenue 18% reflecting overall activity levels, including the rephasing of the In Salah southern fields development in Algeria and the Upper Zakum project in Abu Dhabi Net profit 7% representing a…
Offshore Projects and Operations Revenue 19% strong growth reflecting higher levels of activity, including on Laggan-Tormore and operations support contracts, particularly in Iraq Net profit 13% reflecting increased levels of…
Engineering & Consulting Services Revenues 48% strong growth reflecting substantial increase in activity levels, including significant activity on a project in Malaysia and the consolidation of RNZ from April 2013 Net profit 10%…
Integrated Energy Services Revenue 32% strong revenue growth reflecting an increase in activity and production on the PECs in Mexico and an increase in production from Block PM304 in Malaysia, following commencement of production…
Outlook US3 billion of new awards in 2014 to In IES, we remain focused on delivery of date, which, together with our opening key milestones on existing projects and backlog (US15 billion), gives good continue to see strong industry…
Appendices
Appendix 1: Group organisation structure Divisions Engineering, Construction, Operations & Integrated Energy Services (IES) Maintenance (ECOM) Chief Operating Officer, Chief Executive, Marwan Chedid Rob Jewkes Onshore…
Appendix 2: Key ECOM projects NOC/NOC led company/consortium Joint NOC/IOC company/consortium IOC/IOC led company/consortium Original contract value to Petrofac Gas sweetening facilities project, Qatar US600m Laggan-Tormore gas…
Appendix 3: Key IES projects Production Enhancement Contracts (PEC) END DATE 2025 (+10 YR TRANSITION Ticleni, Romania PERIOD EXTENSION OPTION) TRANSITION Magallanes and Santuario, Mexico PERIOD 2037 TRANSITION Pnuco, Mexico *…
Appendix 5: Segmental performance Onshore Engineering & Construction earned 54% of Group revenue and 67% of net profit Middle East and Africa: due to geographic diversification, represents only 46% of revenues in 2013 CIS and Asia:…
Appendix 6: Employees Approximately 18,300 people in 7 key operating centres and 24 offices Around 30% of our employees are shareholders/participants in employee share schemes Total headcount 3,200 6,100 3,900…
Notes EBITDA means earnings before interest, tax, depreciation and amortisation and is calculated as profit from operations before tax and finance costs adjusted to add back charges for depreciation and amortisation Net profit (for…
 Loading...