Ship Finance International Limited 3Q 2014 Results November 25, 2014 1
3Q 2014 highlights Quarterly dividend of 0.41 per share Dividend yield of approximately 9.8%(3) Net income of 34.6 million ( 0.37/share) for the quarter Aggregate charter revenue of 176 million (1.88/share)(1) EBITDA(2) of 146…
Recent events Delivery of two 82,000 dwt drybulk carriers Vessels built in 2012 and delivered to us in July and August 2014 More than 8 year remaining time-charters to a state-owned Chinese operator Funded by cash initially but…
4.6 billion charter backlog(1) Charterers by Mkt. Cap Revenues per segment mill. 5bn < 5bn 38% 47% 600 400 200 0 Private 2014(2) 2015 2016 2017 15% Offshore Tanker Drybulk Liner 1) Fixed charter backlog as of…
Drilling rigs and counterparties Seadrill Limited 3 x UDW units (West Polaris, West Hercules, West Taurus), built 2008 Loan…
Frontline vessels Vessels and cash flow 12 VLCCs and 5 Suezmaxes(3) 19.5m base EBITDA contribution in 3Q 2014 21.4m in accumulated cash sweep as per Sep 30, 2014 Financing relating to FRO vessels 1 400m 1 200m 1 000m 800m…
Contributions from projects last 12 months(1) Large performing fleet with significant cash flow 519m EBITDA-equivalent last twelve months 186m net cash flow from projects after interest and debt amortization(3) mill. 800 23 600…
SFL operational performance Pro-forma illustration of cash flow (1) Not as accounted for under US GAAP Used as an internal guideline to assess the Company's performance Excluding extraordinary and non-cash items and profit share…
Profit & loss INCOME STATEMENT Three months ended Full year (in thousands of Sep 30, Jun 30, 2013 except per share data) 2014 2014 (audited) Charter revenues - operating lease 51 759 47 562 156 238 Charter revenues - finance lease 34…
Balance sheet BALANCE SHEET Sep 30, Jun 30, (in thousands of ) 2014 2014 ASSETS Short term Cash and cash equivalents 32 623 49 480 Available for sale securities 62 299 61 889 Amount due from related parties 38 140 30 204 Other current…
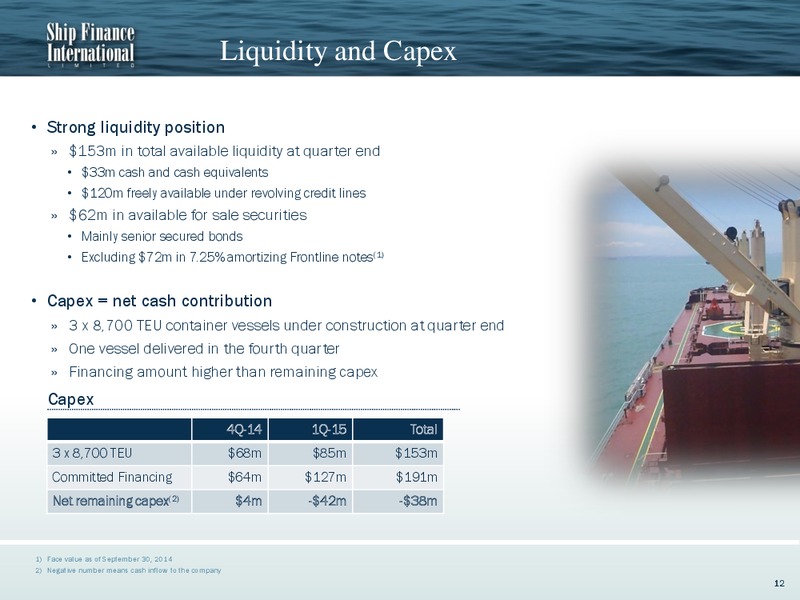
Liquidity and Capex Strong liquidity position 153m in total available liquidity at quarter end 33m cash and cash equivalents 120m freely available under revolving credit lines 62m in available for sale securities Mainly senior…
Summary Reported net income of 34.6m in the third quarter Including 8.0m cash sweep and profit share EBITDA(1) equivalent cash flow of 146m from our 100% owned vessels and rigs Quarterly dividend of 0.41 per share 9.8% dividend…
 Loading...