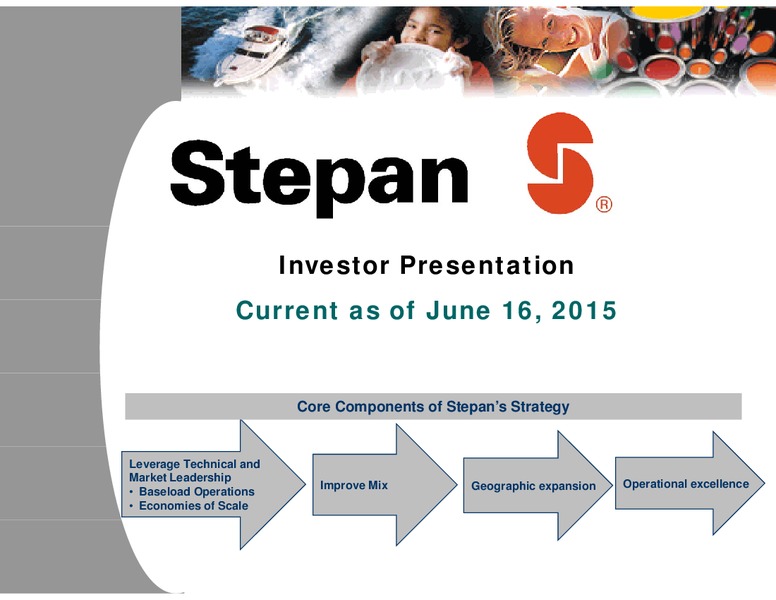
Investor Presentation Current as of June 16, 2015 Core Components of Stepans Strategy Leverage Technical and Market Leadership Improve Mix Geographic expansion Operational excellence Baseload Operations Economies of Scale
Stepan p Company p y Profile 2014 Sales 1.9B in Sales 4% 3 Reportable Segments 17 manufacturing sites with 29% operations in 12 countries Surfactants Polymers 2000 employees Specialty 67% Traded on NYSE as SCL 2
Stepan Company Profile MM USD Net Income * Operating Income 100 2014 = 132MM 80 8% 60 Surfactants 47% Polymers 45% Specialty 40 Q1 2015 Adjusted NI ** 20.4MM vs. 12.8MM in Q1 2014 20 Operating Income 2014 Q1 2015 % of…
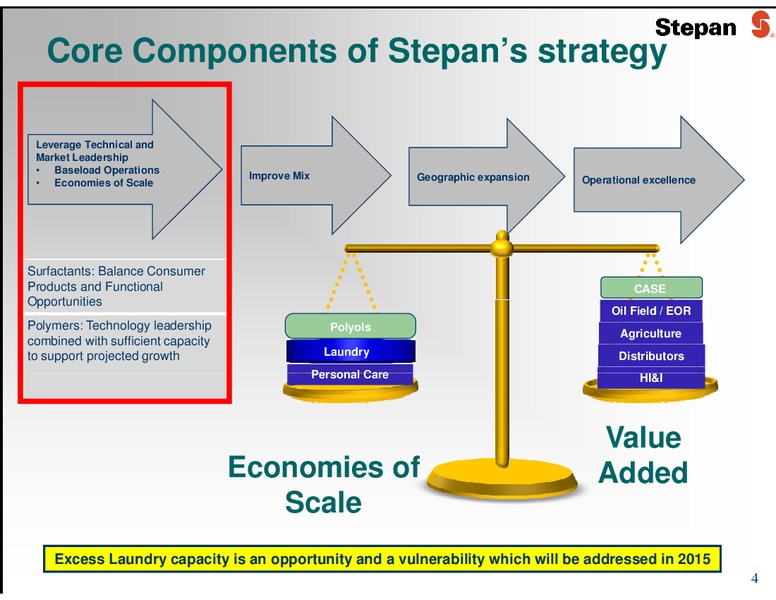
Core Components of Stepans strategy Leverage Technical and Market Leadership Baseload Operations Improve Mix Geographic expansion Operational excellence Economies of Scale Surfactants: Balance Consumer Products and Functional…
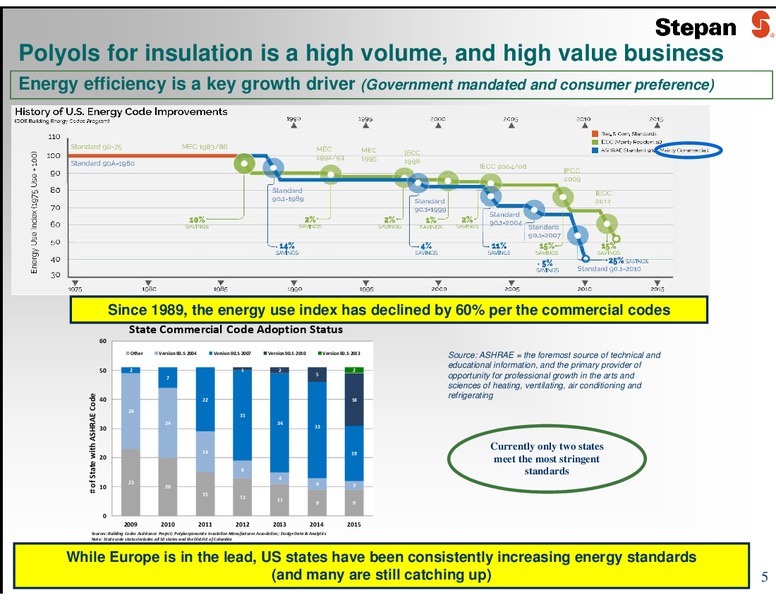
Polyols for insulation is a high volume, and high value business E Energy efficiency ffi i is i a key k growth th driver di (G (Government t mandated d t d and d consumer preference) f ) Europe leads the way way, but the US…
Core Components of Stepans strategy Leverage Technical and Market Leadership Improve Mix Geographic expansion Operational excellence Baseload Operations Economies of Scale Drive growth in Functional Surfactants Drive growth…
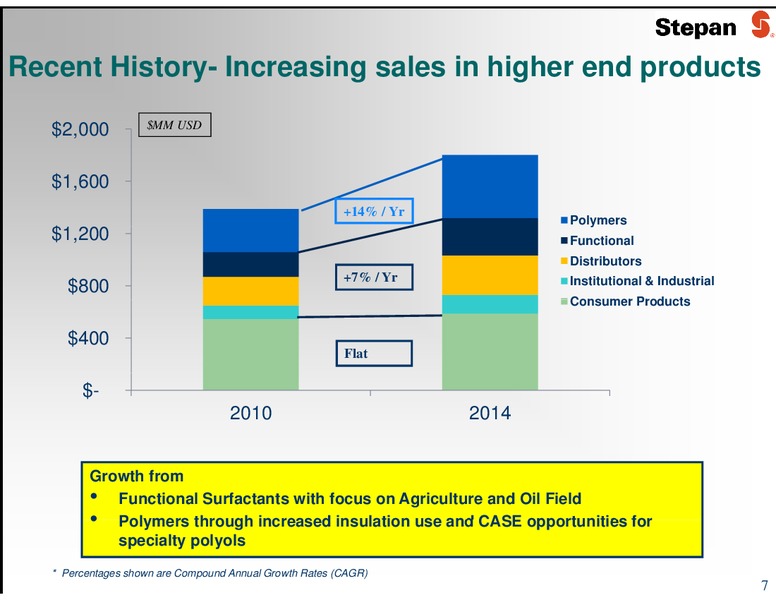
Recent History- y Increasing g sales in higher g end products p MM USD 2,000 1,600 +14% / Yr Polymers y 1 200 1,200 Functional Distributors +7% / Yr Institutional & Industrial 800 Consumer Products 400 Flat - 2010…
Global Agriculture presents an attractive opportunity for growth Global Agriculture remains very attractive despite recent headwinds 2014 was a difficult year industry-wide but not expected to repeat Global population growth…
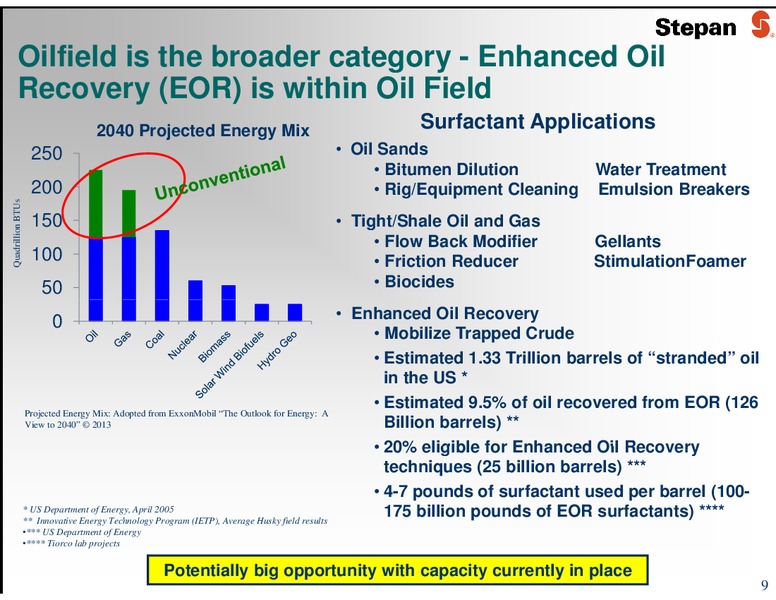
Oilfield is the broader category - Enhanced Oil R Recovery (EOR) iis within ithi Oil Field Fi ld 2040 Projected Energy Mix Surfactant Applications 250 Oil Sands Bitumen Dilution Water Treatment 200 Rig/Equipment Cleaning Emulsion…
Core Components of Stepans strategy Leverage Technical and Market Leadership Improve Mix Geographic expansion Operational excellence Baseload Operations Economies of Scale Surfactants Brazil Polymers China 10
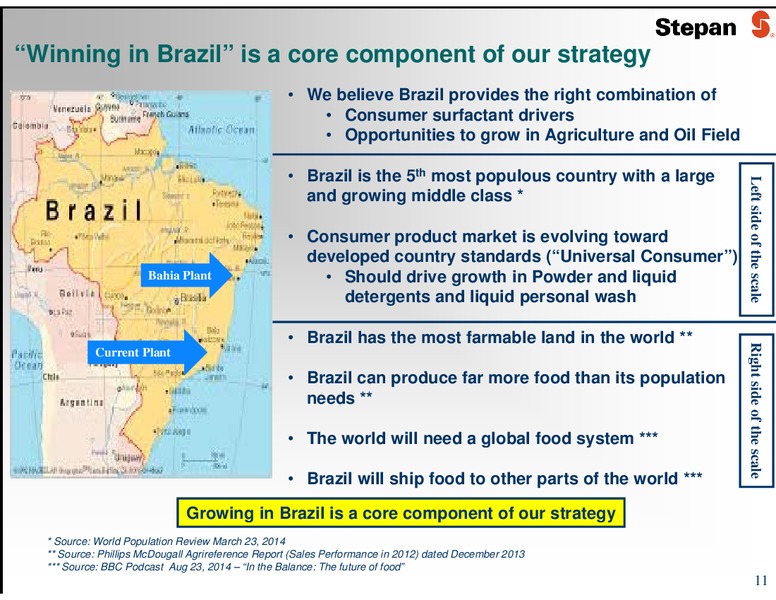
Winning in Brazil is a core component of our strategy We believe Brazil provides the right combination of Consumer surfactant drivers Opportunities to grow in Agriculture and Oil Field Brazil is the 5th most populous country with a…
Growing Polymers in China is also key to our strategy China is a large, growing market for insulation z Chinese Government is mandating greater energy efficiency throughout economy and more use of insulation z Significant MDI*…
Global MDI Capacity MDI is the component Thousand Metric Tons product to our Polyol to produce Rigid 4,000 , Insulation Foam China 2x Chi 2 capacity it from f 2012 to t 2014 China passes NA and W EU in 2014 3,500 3,000 ,…
Core Components of Stepans strategy Leverage Technical and Market Leadership Improve Mix Geographic expansion Operational excellence Baseload Operations Economies of Scale Q4 2013 restructuring which reduced North America…
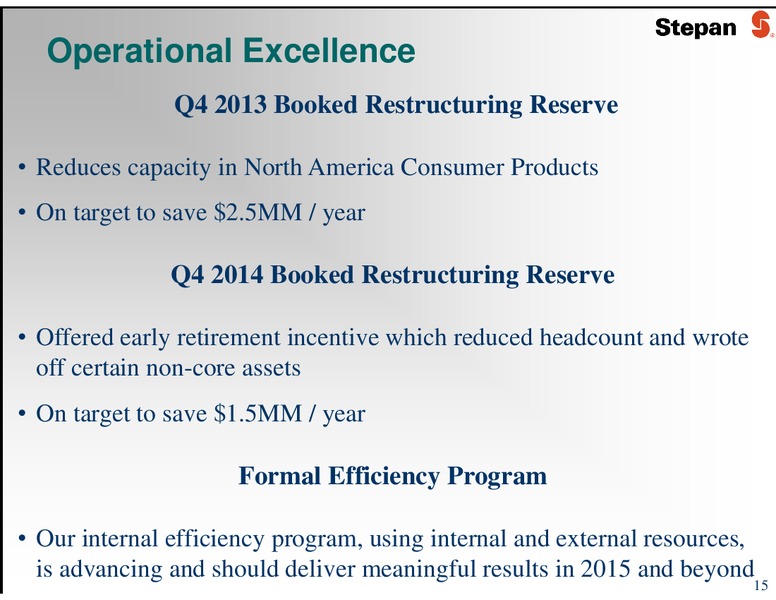
Operational Excellence Q4 2013 Booked Restructuring Reserve Reduces capacity in North America Consumer Products On target to save 2.5MM / year Q4 2014 Booked Restructuring Reserve Offered early retirement incentive which reduced…
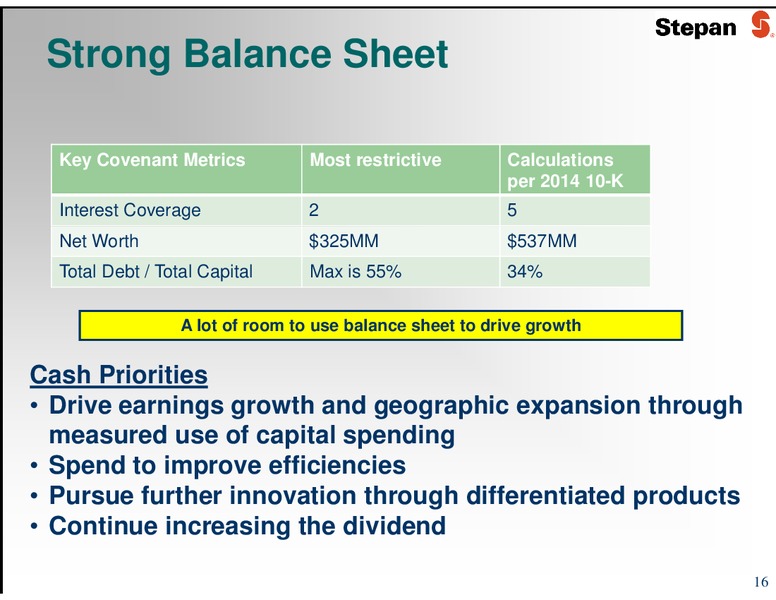
Strong Balance Sheet K C Key Covenant Metrics M i M Most restrictive i i Calculations C l l i per 2014 10-K Interest Coverage 2 5 Net Worth 325MM 537MM Total Debt / Total Capital Max is 55% 34% A lot of room to use balance…
Leveraging the Balance Sheet to drive future earnings growth MM USD 140 Recent key investments 130 R&D facilities in Brazil, China, and France Surfactants 120 US - Specialty surfactants Brazil - Neutralization capacity 102 100 93…
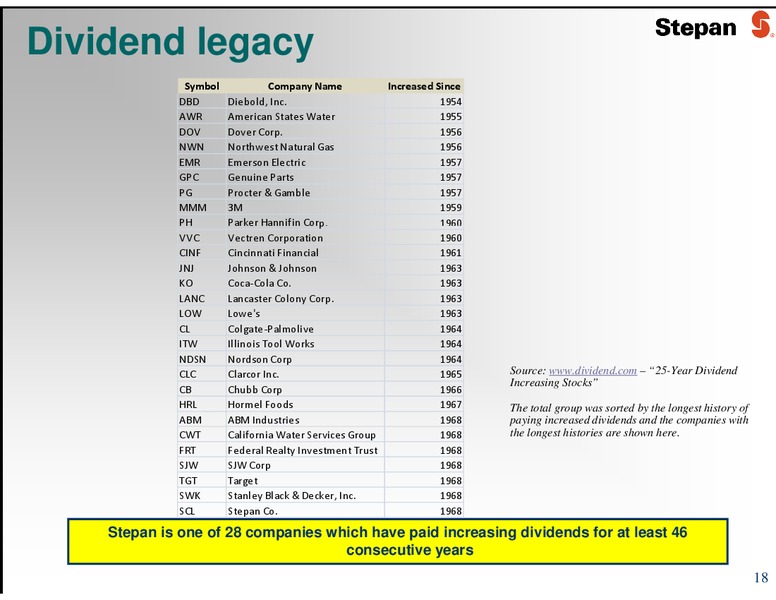
Dividend legacy Symbol Company Name Increased Since DBD Diebold, Inc. 1954 AWR American States Water 1955 DOV Dover Corp. 1956 NWN Northwest Natural Gas 1956 EMR Emerson Electric 1957 GPC Genuine Parts 1957 PG Procter & Gamble…
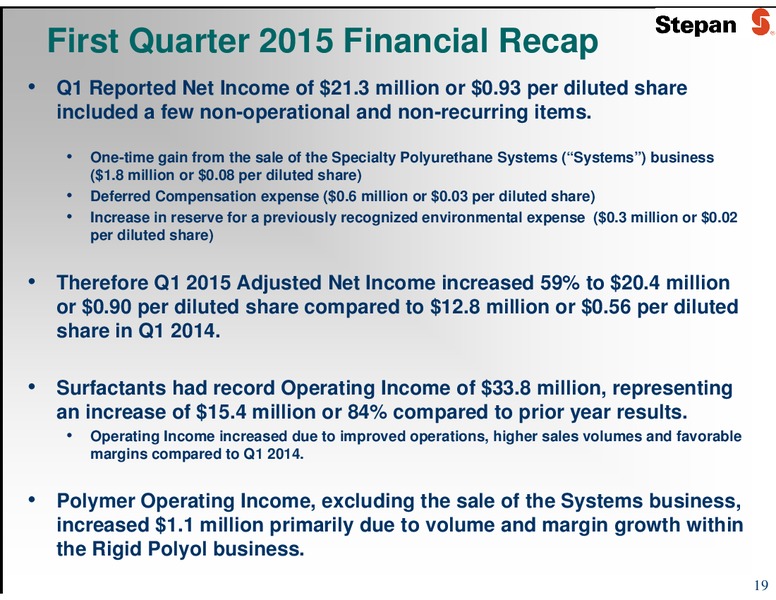
First Quarter 2015 Financial Recap Q1 Reported Net Income of 21.3 million or 0.93 per diluted share included a few non-operational and non-recurring items. One-time O ti gain i from f the th salel off the th Specialty S i lt…
2014 versus 2015 (as shown in the Q1 2015 earnings call) ** Potential Potential Improvements Headwinds Net EPS * Net EPS * Income Income Surf Vol/Mix Items (6MM) ** (0.25) Non-Recurring Maintenance and +6MM +0.25 Shutdown costs…
Expectations for 2015 * z Continued income growth in Polymers z Higher Functional Surfactant volumes z Improve asset utilization in North America z Improve Operations z Stronger US Dollar would negatively impact earnings z Benefits…
Thank you for your interest in Stepan Company (NYSE: SCL) Contact information: Scott Beamer CFO 847-446-7500 22
Appendix pp I Reg G reconciliation: Net Income Excluding Deferred Compensation expense/income to Reported Net Income Reconciliation of Net Income Excluding Deferred Compensation (Amounts in Millions) Years Ended December 31…
Appendix pp II RECONCILIATIONS FOR ADJUSTED NET INCOME AND ADJUSTED DILUTED EARNINGS PER SHARE Three Months Ended Three Months Ended (Amounts in Millions, Except per Share Amounts) March 31 2015 2014 Net Income Diluted EPS…
 Loading...