1Q 2010 Financial Results (US GAAP) Leonid Fedun, Vice-President of LUKOIL June 2010
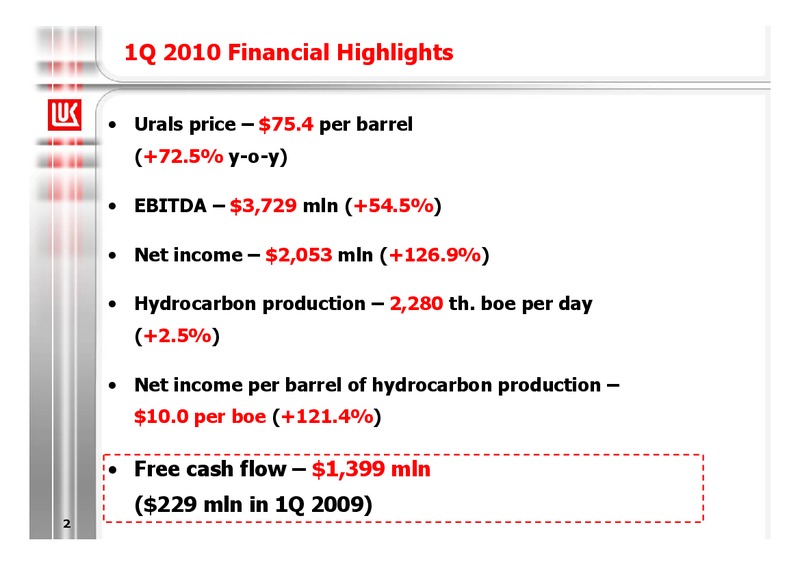
1Q 2010 Financial Highlights Urals price 75.4 per barrel (+72.5% y-o-y) EBITDA 3,729 mln (+54.5%) Net income 2,053 mln (+126.9%) Hydrocarbon production 2,280 th. boe per day (+2.5%) Net income per barrel of hydrocarbon…
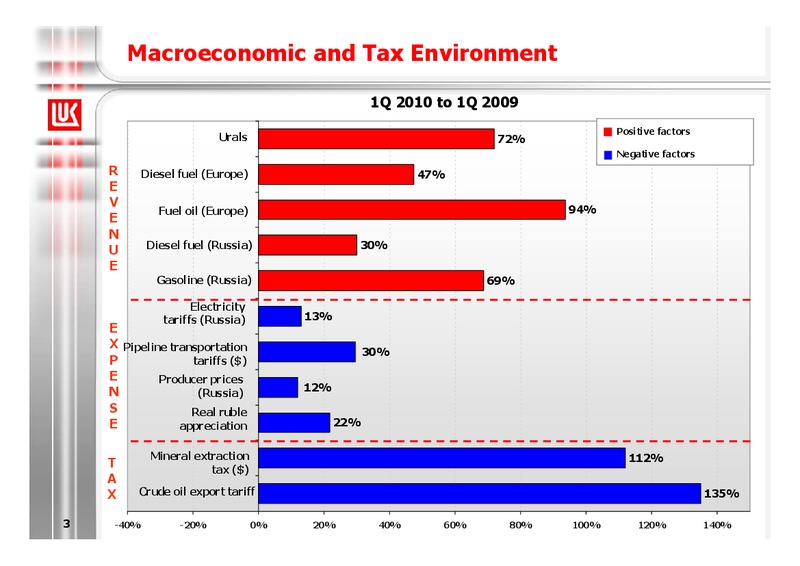
Macroeconomic and Tax Environment 1Q 2010 to 1Q 2009 Positive factors Urals 72% Negative factors R Diesel fuel (Europe) 47% E V Fuel oil (Europe) 94% E N U Diesel fuel (Russia) 30% E Gasoline (Russia) 69% Electricity…
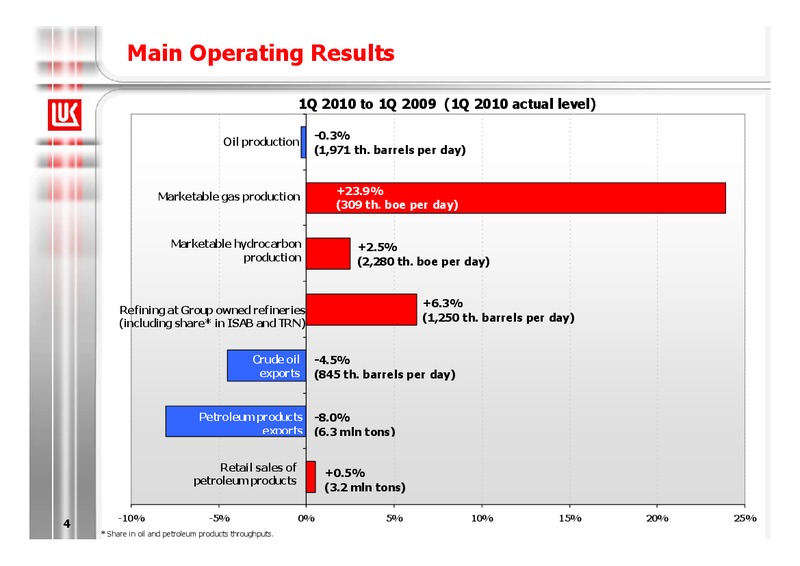
Main Operating Results 1Q 2010 to 1Q 2009 (1Q 2010 actual level) -0.3% Oil production (1,971 th. barrels per day) +23.9% Marketable gas production (309 th. boe per day) Marketable hydrocarbon +2.5% production (2,280 th.…
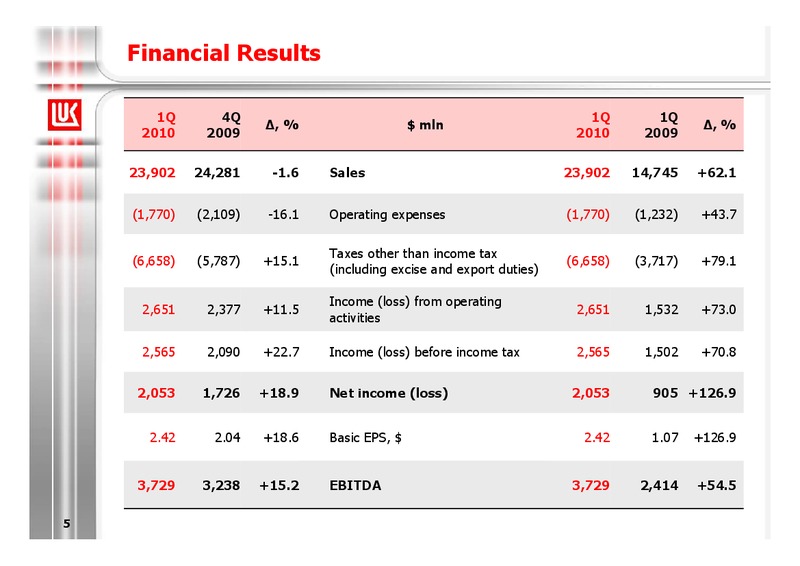
Financial Results 1Q 4Q 1Q 1Q , % mln , % 2010 2009 2010 2009 23,902 24,281 -1.6 Sales 23,902 14,745 +62.1 (1,770) (2,109) -16.1 Operating expenses (1,770) (1,232) +43.7 Taxes other than income tax (6,658) (5,787) +15.1…
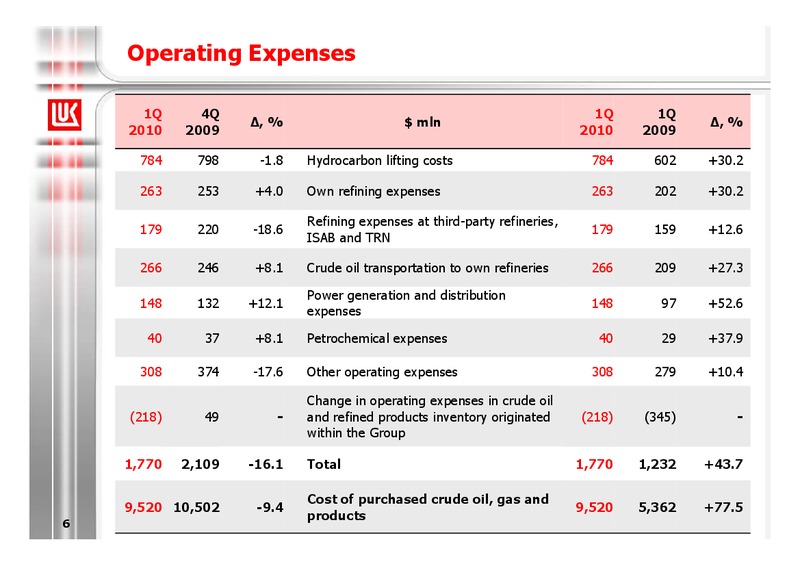
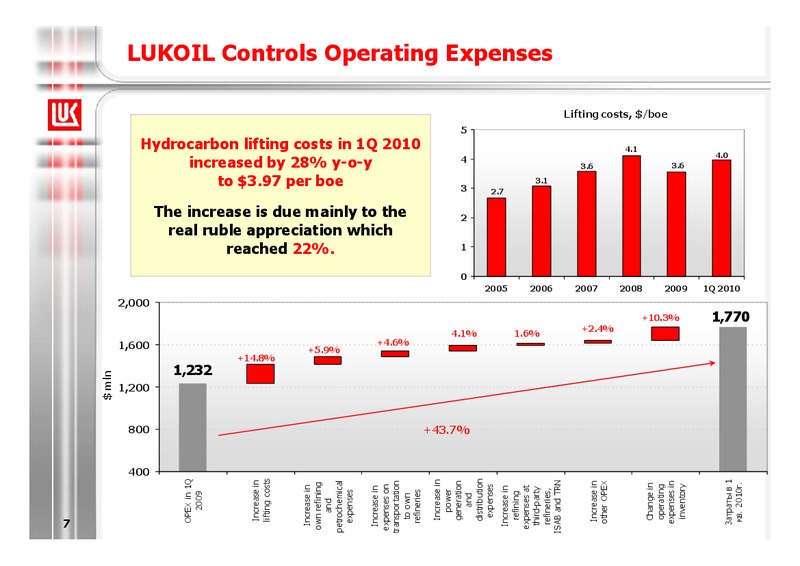
7 mln 400 800 1,200 1,600 2,000 OPEX in 1Q 2009 1,232 Increase in lifting costs +14.8% Increase in own refining and reached 22%. +5.9% to 3.97 per boe petrochemical expenses increased by 28%…
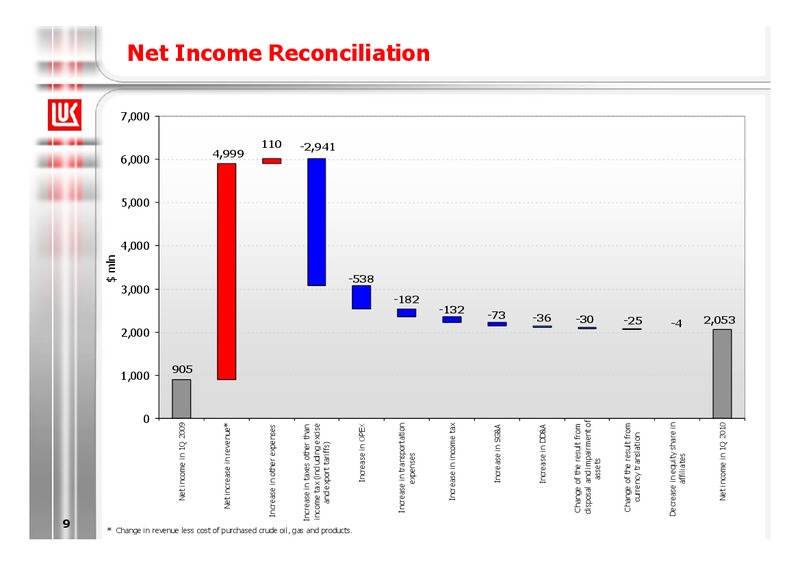
9 mln 0 1,000 2,000 3,000 4,000 5,000 6,000 7,000 Net income in 1Q 2009 905 Net increase in revenue* 4,999 Increase in other expenses 110 Increase in taxes other than income tax (including excise and…
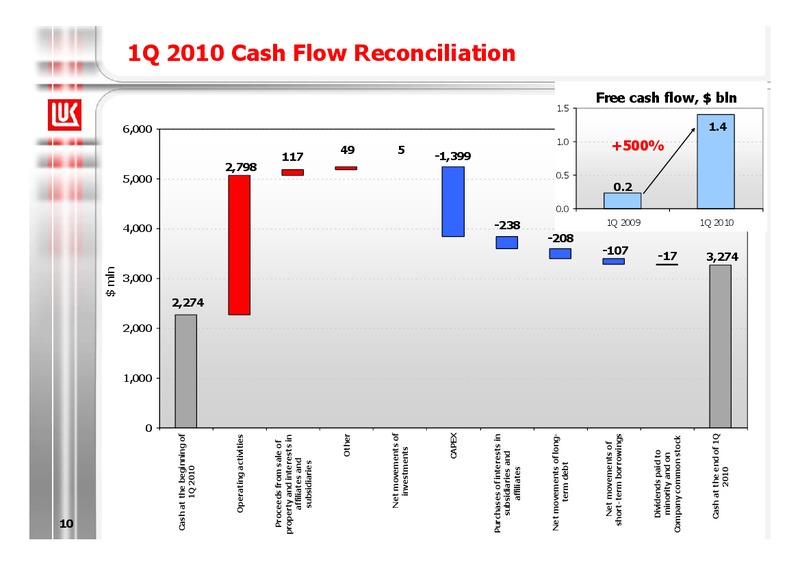
10 mln 0 1,000 2,000 3,000 4,000 5,000 6,000 Cash at the beginning of 1Q 2010 2,274 Operating activities 2,798 Proceeds from sale of property and interests in affiliates and 117 subsidiaries Other…
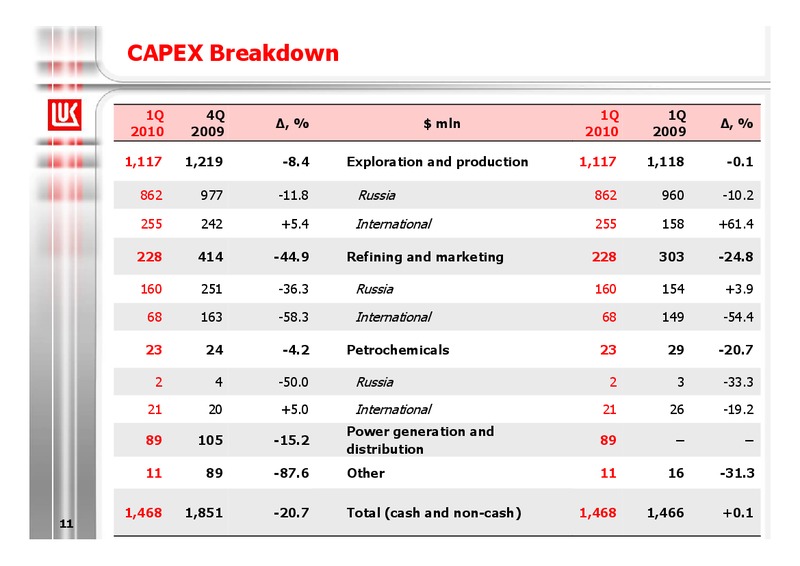
CAPEX Breakdown 1Q 4Q 1Q 1Q , % mln , % 2010 2009 2010 2009 1,117 1,219 -8.4 Exploration and production 1,117 1,118 -0.1 862 977 -11.8 Russia 862 960 -10.2 255 242 +5.4 International 255 158 +61.4 228 414 -44.9 Refining and…
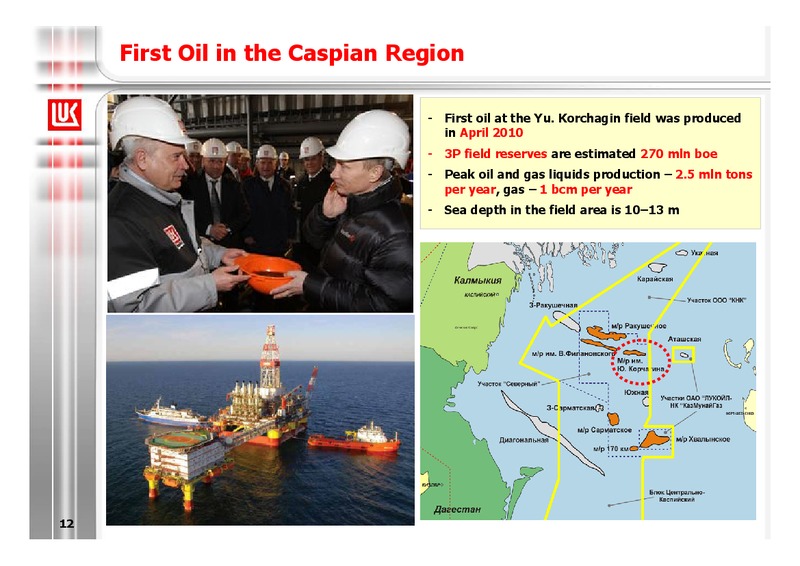
First Oil in the Caspian Region - First oil at the Yu. Korchagin field was produced in April 2010 - 3P field reserves are estimated 270 mln boe - Peak oil and gas liquids production 2.5 mln tons per year, gas 1 bcm per year - Sea…
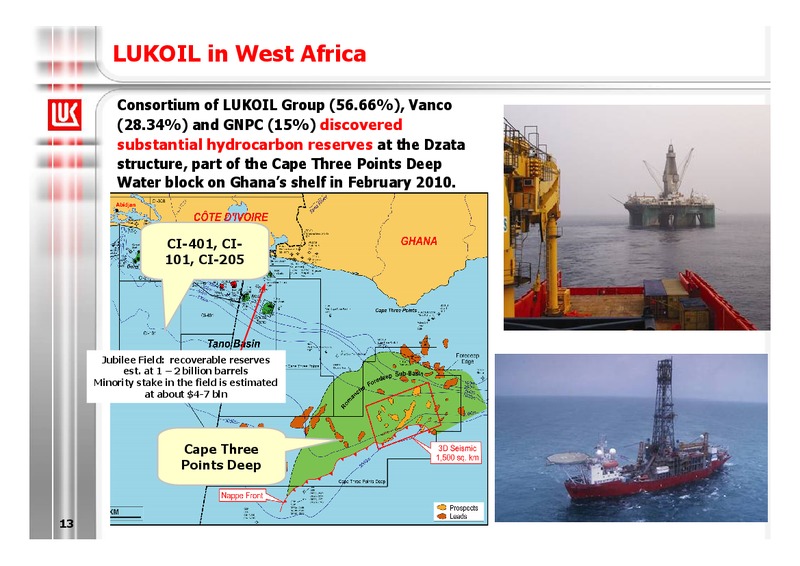
LUKOIL in West Africa Consortium of LUKOIL Group (56.66%), Vanco (28.34%) and GNPC (15%) discovered substantial hydrocarbon reserves at the Dzata structure, part of the Cape Three Points Deep Water block on Ghanas shelf in February…
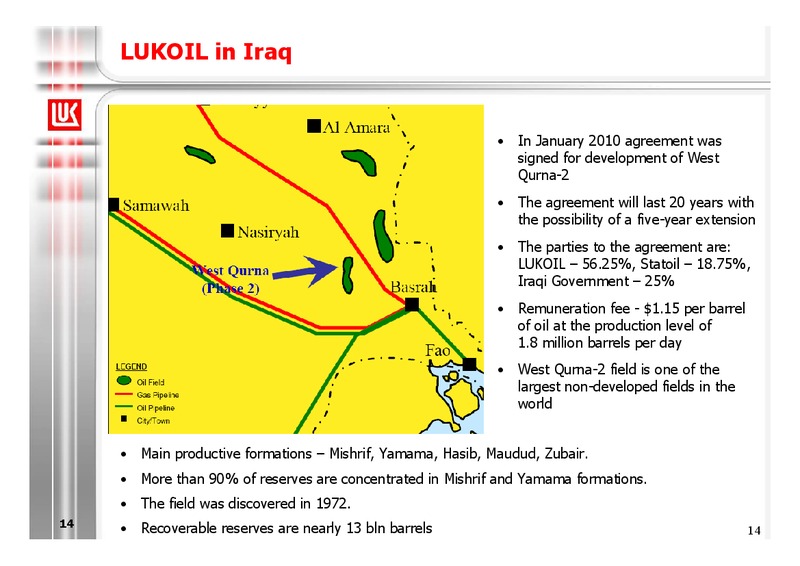
LUKOIL in Iraq In January 2010 agreement was signed for development of West Qurna-2 The agreement will last 20 years with the possibility of a five-year extension The parties to the agreement are: LUKOIL 56.25%, Statoil 18.75%,…
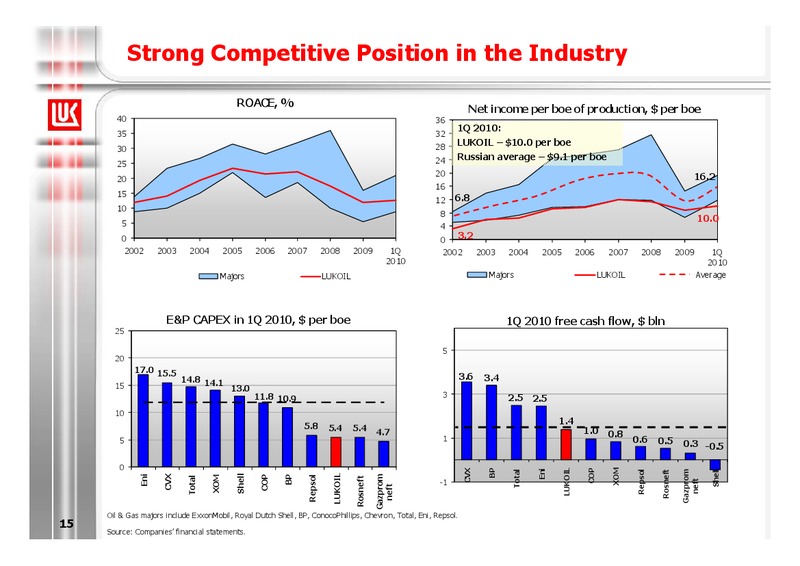
Strong Competitive Position in the Industry ROACE, % Net income per boe of production, per boe 40 36 1Q 2010: 35 32 28 LUKOIL 10.0 per boe 30 24 Russian average 9.1 per boe 25 20 16.2 20 16 15 12 6.8 10 8 10.0 5 4 0…
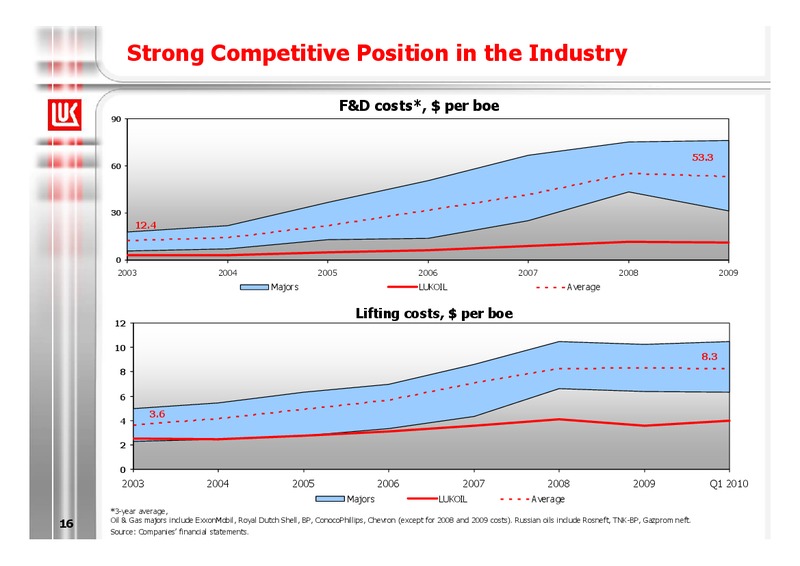
Strong Competitive Position in the Industry F&D costs*, per boe 90 53.3 60 30 12.4 0 2003 2004 2005 2006 2007 2008 2009 Majors LUKOIL Average Lifting costs, per boe 12 10 8.3 8 6 3.6 4 2 0 2003 2004…
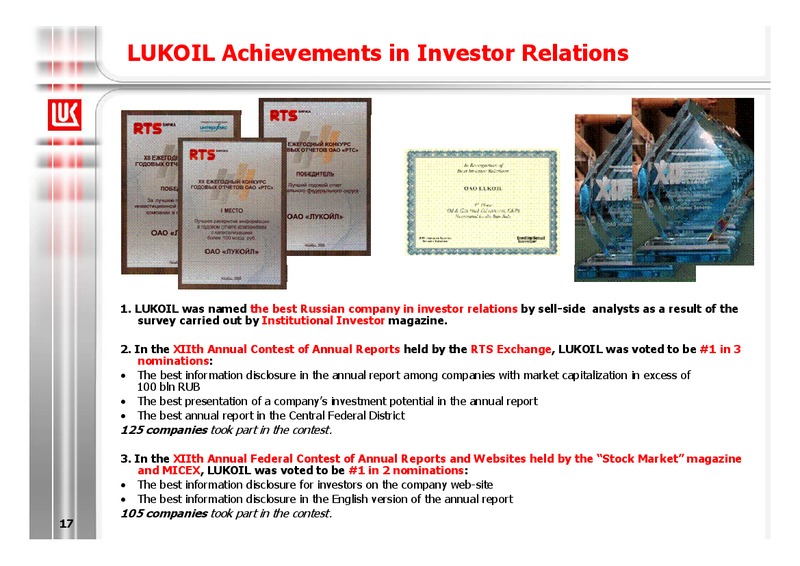
LUKOIL Achievements in Investor Relations 1. LUKOIL was named the best Russian company in investor relations by sell-side analysts as a result of the survey carried out by Institutional Investor magazine. 2. In the XIIth Annual…
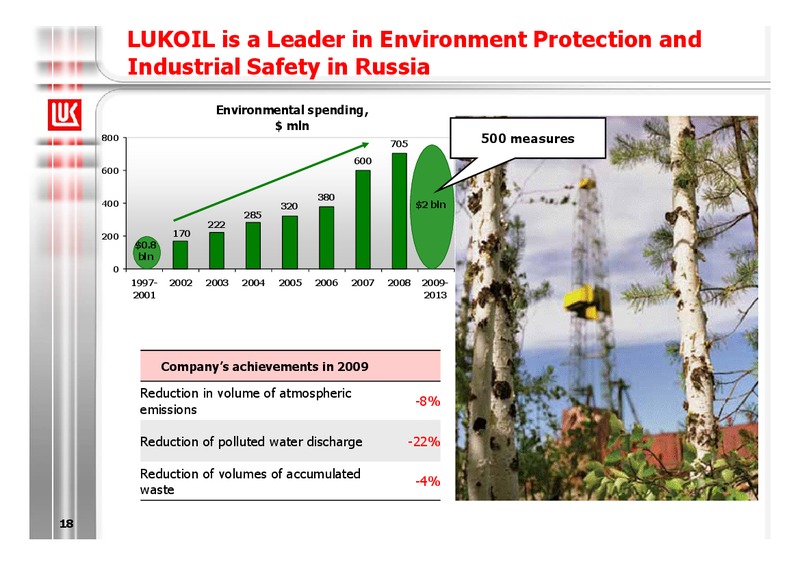
LUKOIL is a Leader in Environment Protection and Industrial Safety in Russia Environmental spending, mln 800 705 500 measures 600 600 380 400 320 2 bln 285 222 200 170 0.8 bln 0 1997- 2002 2003 2004 2005 2006 2007 2008…
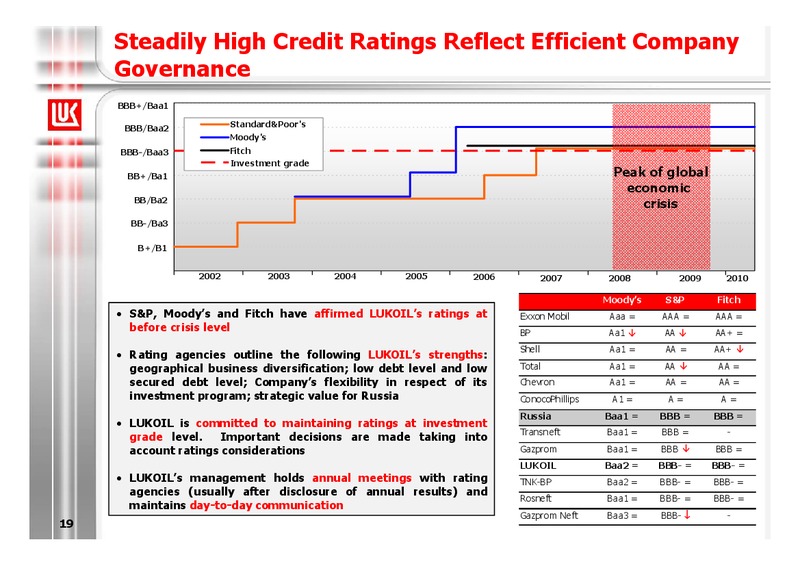
Steadily High Credit Ratings Reflect Efficient Company Governance BBB+/Baa1 BBB/Baa2 Standard&Poor's Moody's BBB-/Baa3 Fitch Investment grade BB+/Ba1 Peak of global economic BB/Ba2 crisis BB-/Ba3 B+/B1 2002 2003 2004…
Conclusion To maintain the proper balance between the growth rate of the Company business and high financial efficiency Highly profitable E&P projects development Good financial position, high cash flows Increase in…
 Loading...