Financial results All earnings figures are adjusted for the Gulf of Mexico oil spill, other non-operating items and fair value accounting effects. Replacement cost profit before interest and tax (bn) 3Q09 3Q10 3Q10 vs 3Q09 (bn)…
Gulf of Mexico oil spill costs and provisions (pre-tax, pre-partner recovery) bn 2Q10 3Q10 Income statement Charge for the period 32.2 7.7 Balance sheet * Brought forward 0 30.1 Charge/ (credit) to income statement 32.2 7.7…
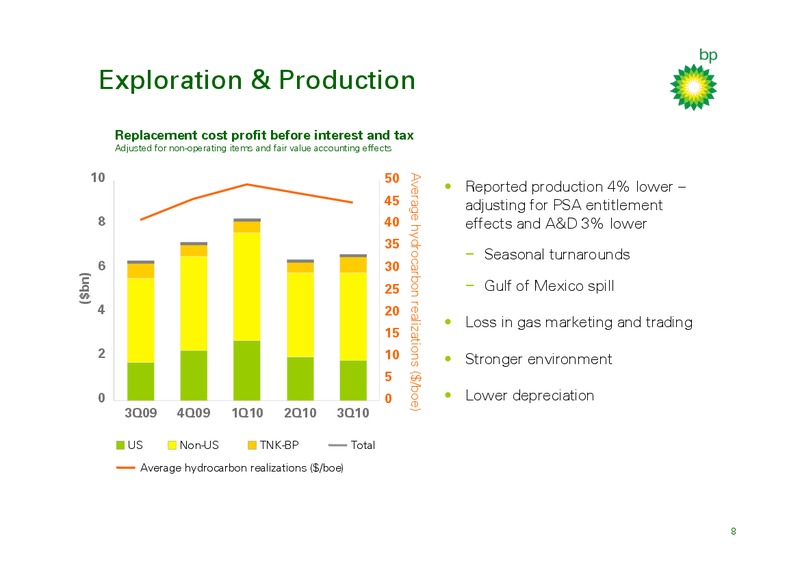
Exploration & Production Replacement cost profit before interest and tax Adjusted for non-operating items and fair value accounting effects 10 50 Average hydrocarbon realizations (/boe) Reported production 4% lower 45…
Refining & Marketing Replacement cost profit before interest and tax Adjusted for non-operating items and fair value accounting effects 2.0 12.0 Refining indicator margin (/bbl) 10.0 1.5 8.0 Continued strong operational…
Other businesses & corporate Replacement cost profit before interest and tax Adjusted for non-operating items and fair value accounting effects 0.2 0 (0.2) Guidance remains at 400 million (bn) average underlying charge…
Sources & uses of cash YTD 2009 YTD 2010 35 Disposal proceeds of 3.7 billion for 30 deals closed in 3Q Disposals Gulf of 25 Mexico Further 5.0 billion of cash received for disposals closing after 3Q (bn post-tax)…
Net debt 30 25 20 (bn) 15 Range of 10 to 15bn 10 5 0 2001 2002 2003 2004 2005 2006 2007 2008 2009 2010 2011 1. Net debt includes the fair value of associated derivative financial instruments used to hedge finance…
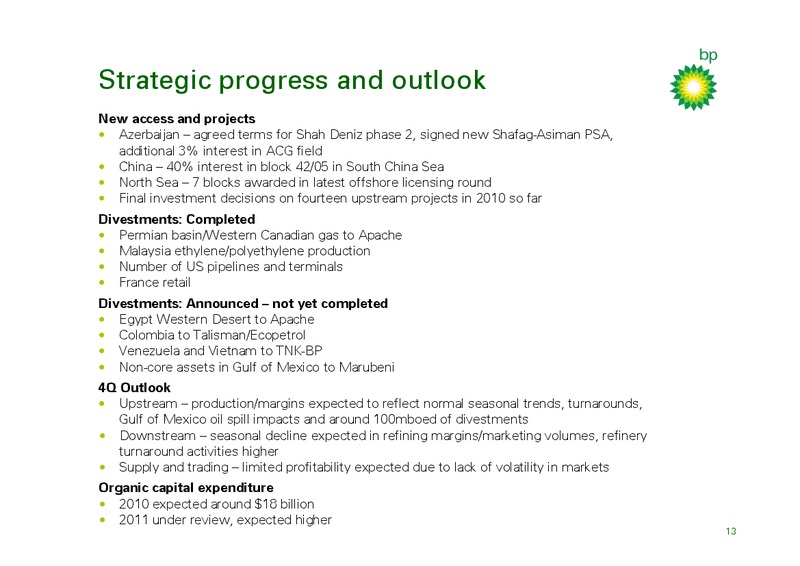
Strategic progress and outlook New access and projects Azerbaijan agreed terms for Shah Deniz phase 2, signed new Shafag-Asiman PSA, additional 3% interest in ACG field China 40% interest in block 42/05 in South China Sea North Sea 7…
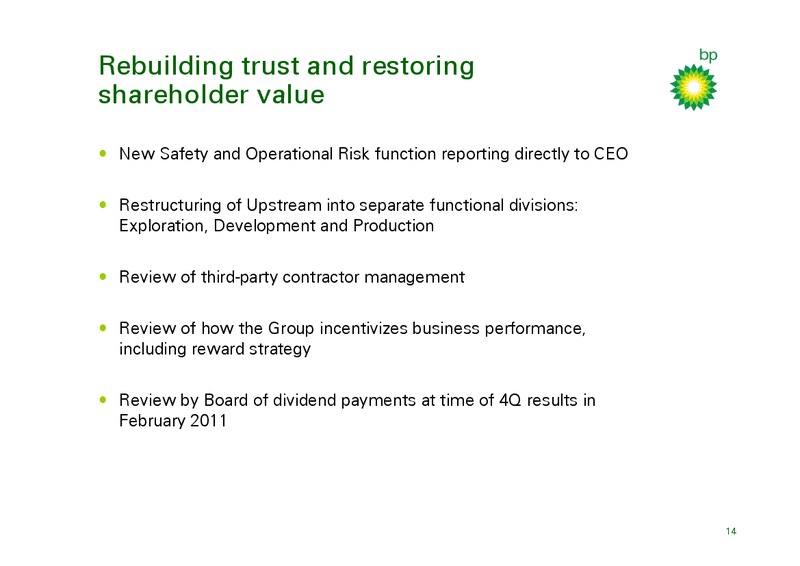
Rebuilding trust and restoring shareholder value New Safety and Operational Risk function reporting directly to CEO Restructuring of Upstream into separate functional divisions: Exploration, Development and Production Review of…
Q&A Byron Grote Chief Financial Officer Fergus MacLeod Head of Investor Relations 15
 Loading...