1Q 2011 Financial Highlights Net income 3,517 million ( +71.3% y-o-y) Basic earning per share 4.5 (+85.6% y-o-y) Net Income per boe of production 17.9 per boe (+78.8% y-o-y ) EBITDA 5,343 million (+43.3% y-o-y) 2
Macroeconomic and Tax Environment 1Q 2011 to 1Q 2010 Diesel fuel (Europe), 41.6% Positive factors R Diesel fuel (Russia), 38.7% Negative factors E V Urals, 36.2% E Fuel oil (Russia), 30.3% N U Gasoline (Europe), 27.0% E…
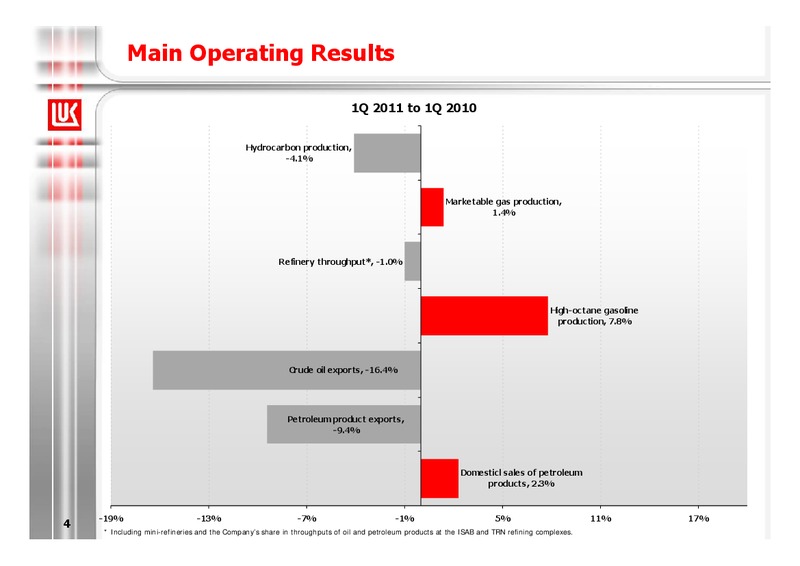
Main Operating Results 1Q 2011 to 1Q 2010 Hydrocarbon production, -4.1% Marketable gas production, 1.4% Refinery throughput*, -1.0% High-octane gasoline production, 7.8% Crude oil exports, -16.4%…
Financial Results 1Q 4Q 1Q 1Q ,% million ,% 2011 2010 2011 2010 29,626 28,684 3.3 Sales 29,626 23,902 23.9 (2,138) (2,133) 0.2 OPEX (2,138) (1,988) 7.5 Taxes other than income tax (7,436) (7,262) 2.4 (including excise and…
Sales Breakdown, million 35,000 Domestic market Other sales* International market 29,626 30,000 Sales of electricity in Russia 16% 23,902 +28.9% 25,000 Sales of gas in Russia 16% Sales of petrochemicals in Russia 20,000…
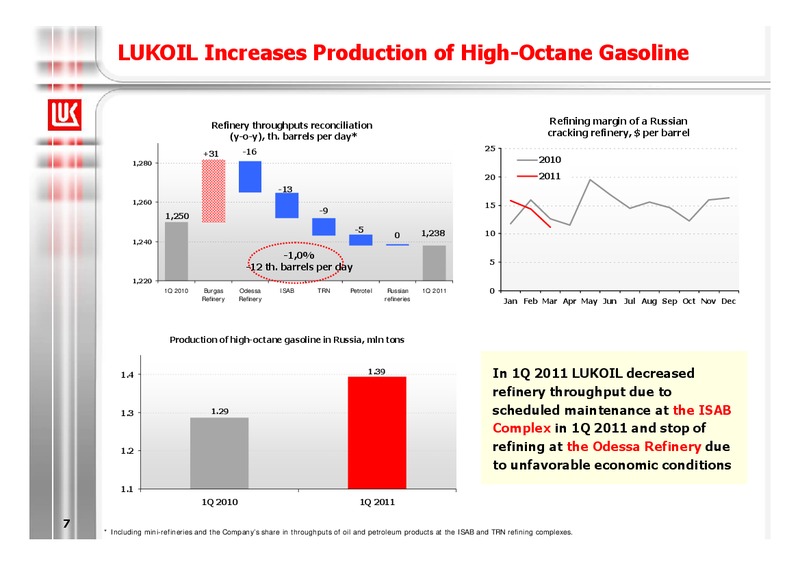
LUKOIL Increases Production of High-Octane Gasoline Refinery throughputs reconciliation Refining margin of a Russian (y-o-y), th. barrels per day* cracking refinery, per barrel -16 25 +31 1,280 2010 20 2011 -13 1,260 15 -9…
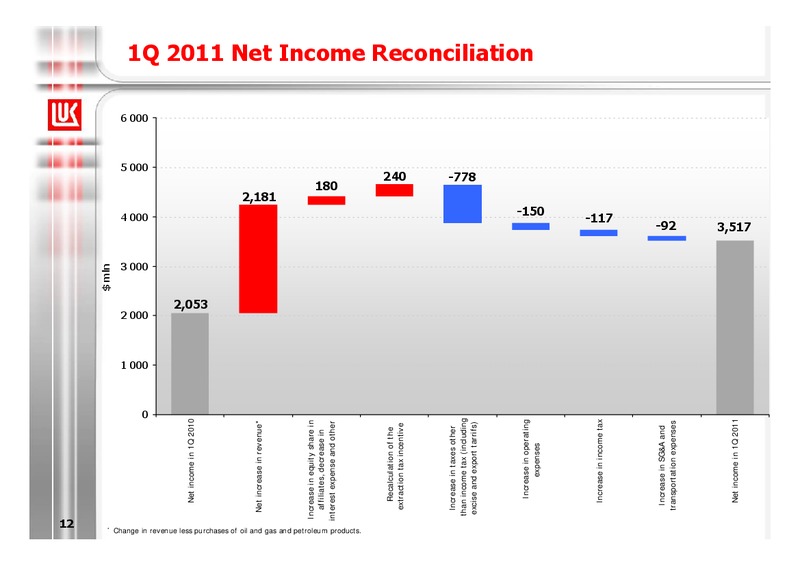
* 12 mln 0 1 000 2 000 3 000 4 000 5 000 6 000 Net income in 1Q 2010 2,053 Net increase in revenue* 2,181 Increase in equity share in affiliates, decrease in interest expense and other 180 Change in…
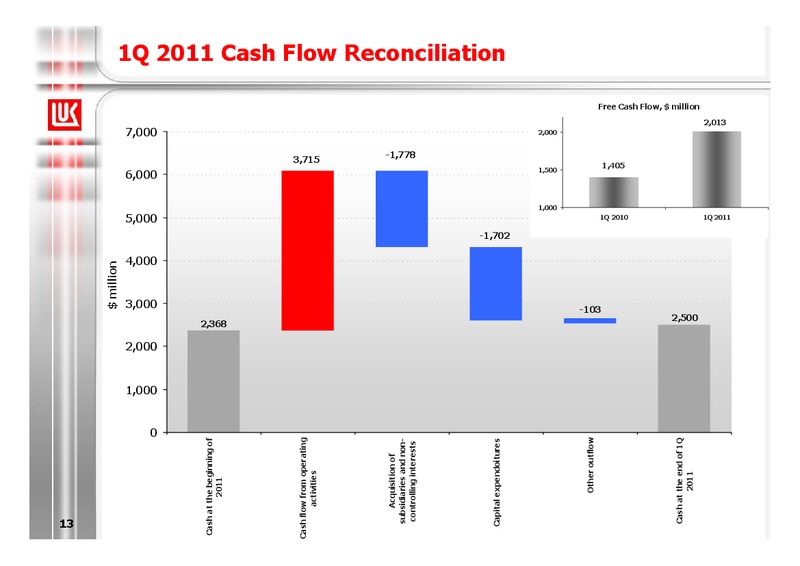
13 million 0 1,000 2,000 3,000 4,000 5,000 6,000 7,000 Cash at the beginning of 2011 2,368 Cash flow from operating activities 3,715 Acquisition of subsidiaries and non- -1,778 controlling…
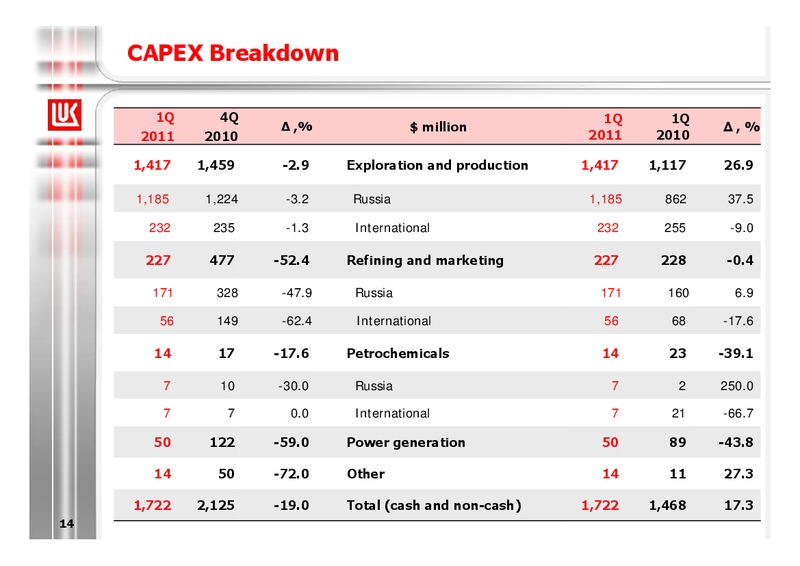
CAPEX Breakdown 1Q 4Q 1Q 1Q ,% million ,% 2011 2010 2011 2010 1,417 1,459 -2.9 Exploration and production 1,417 1,117 26.9 1,185 1,224 -3.2 Russia 1,185 862 37.5 232 235 -1.3 International 232 255 -9.0 227 477 -52.4 Refining…
Western Siberia: Production Trend is Constant Production stabilization (y-o-y), LUKOIL-Western Siberia Application of modern EOR methods 1Q while developing tight reservoirs 2007 2008 2009 2010 2011 2011F 2012F 2013F 0% -1%…
Efficiency Increase in E&P Segment New wells efficiency in Russia 50% 308 300 LUKOIL increases field development barrels per day efficiency due to growth of % 236 31.7% 30% horizontal drilling: 200 29.2% 100…
Techniques of Stabilization and Intensification of Production Drilling of new exploitation wells 100% Underbalanced drilling 80% 60% Completion with expanding 40% packers 20% Multiple completions 0% 2007 2008 Vertical 2009…
Drilling and completion technologies development At Tevlinsko-Russkinskoye field (2 fracs per Addition to reserves, th. barrels well) a flow rate was reached at 1,300 2,500 2,250 barrels per day (2010 - 120 barrels per day) 2,000…
Yuzhnaya Khylchuya field Revision of field reserves, mln barrels Field production, mln barrels 500 -62.6% 53 400 300 43 505 200 33 371 316 100 23 0 13 01.01.2009 01.01.2010 01.01.2011 2009 2010 2011F 2012F 2013F…
New opportunities in Nenetsky Autonomous District Partnership agreement with Bashneft suggests: - joint development of R.Trebs and A.Titov fields R. Trebs Field - Oil transport via the Varandey Oil Export Terminal - supplying…
Partnership with Rosneft Development of Projects with Strategic Reserves R u s s i a Company and Rosneft stipulated an agreement on long-term partnership suggesting: - joint exploration of the Arctic shelf with total…
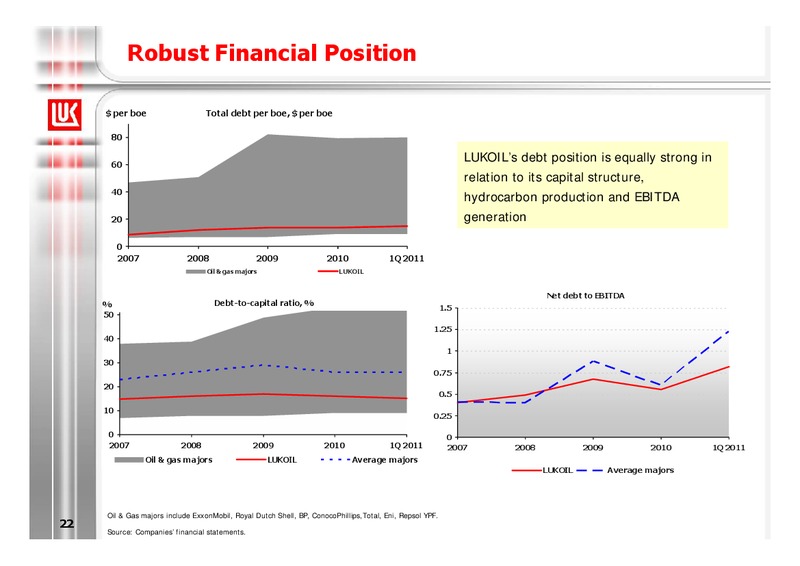
Robust Financial Position per boe Total debt per boe, per boe 80 60 LUKOILs debt position is equally strong in relation to its capital structure, 40 hydrocarbon production and EBITDA 20 generation 0 2007 2008 2009 2010 1Q…
Robust Competitive Position in the Industry Net income per boe, per boe 40 1Q 2011 E&P CAPEX, per boe 36 21 18.8 18.3 18.3 32 18 15.9 28 24 15 20 12 11.1 9.9 16 9 7.2 7.0 12 6 4.9 4.6 8 4 3 0 0 2003 2004 2005 2006…
Strategic Objective Creation of Value by Increasing Recovery Rate Due to implementation of new Recovery Rate Targets technologies and changing of the field 45% development system: 40% resource base will increase by 9 40% billion…
Conclusion Financial and Investment Policy Highlights: - Investment policy focuses on the development of E&P segment, increase of E&P share in total CAPEX - Continuing modernization of Russian refineries under new tax regime -…
 Loading...