2007 Financial Results (US GAAP) Leonid Fedun, Vice-President of LUKOIL April 2008
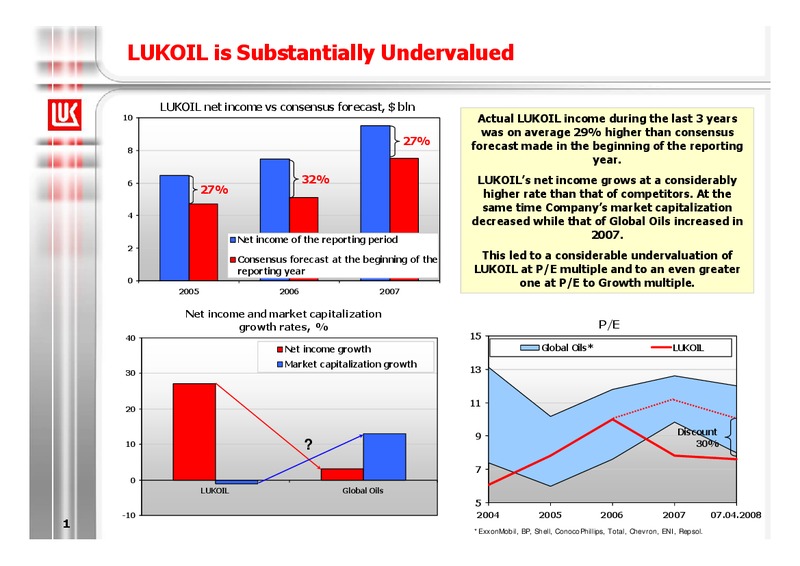
LUKOIL is Substantially Undervalued LUKOIL net income vs consensus forecast, bln 10 Actual LUKOIL income during the last 3 years was on average 29% higher than consensus 27% forecast made in the beginning of the reporting 8 year.…
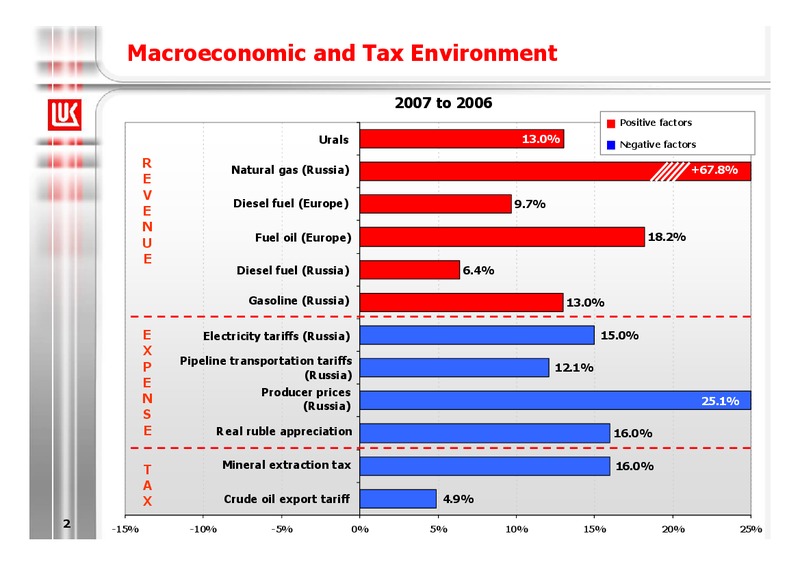
Macroeconomic and Tax Environment 2007 to 2006 Positive factors Urals 13.0% Negative factors R Natural gas (Russia) +67.8% E V Diesel fuel (Europe) 9.7% E N Fuel oil (Europe) 18.2% U E Diesel fuel (Russia) 6.4% Gasoline…
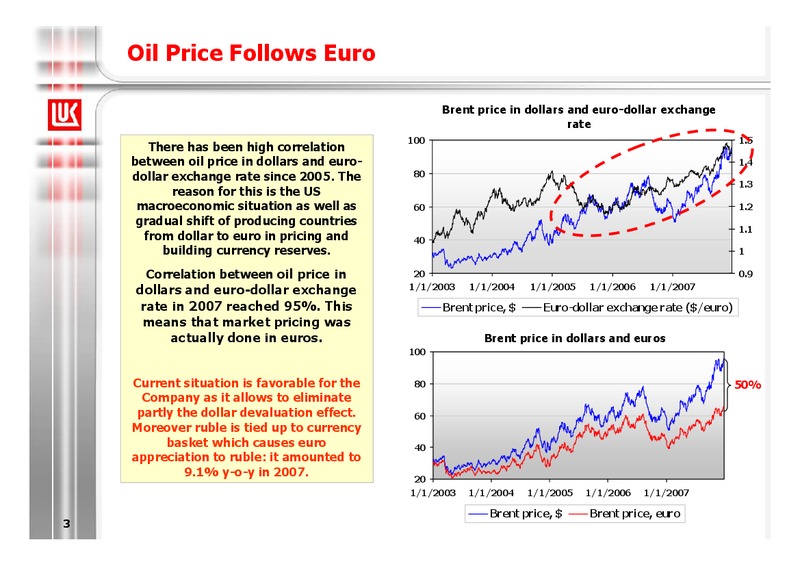
Oil Price Follows Euro Brent price in dollars and euro-dollar exchange rate 100 1.5 There has been high correlation between oil price in dollars and euro- 1.4 dollar exchange rate since 2005. The 80 1.3 reason for this is the…
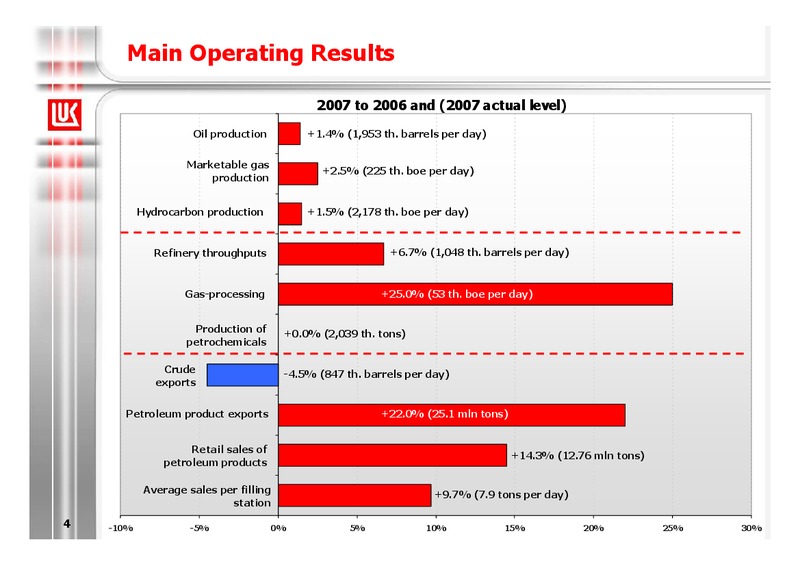
Main Operating Results 2007 to 2006 and (2007 actual level) Oil production +1.4% (1,953 th. barrels per day) Marketable gas +2.5% (225 th. boe per day) production Hydrocarbon production +1.5% (2,178 th. boe per day)…
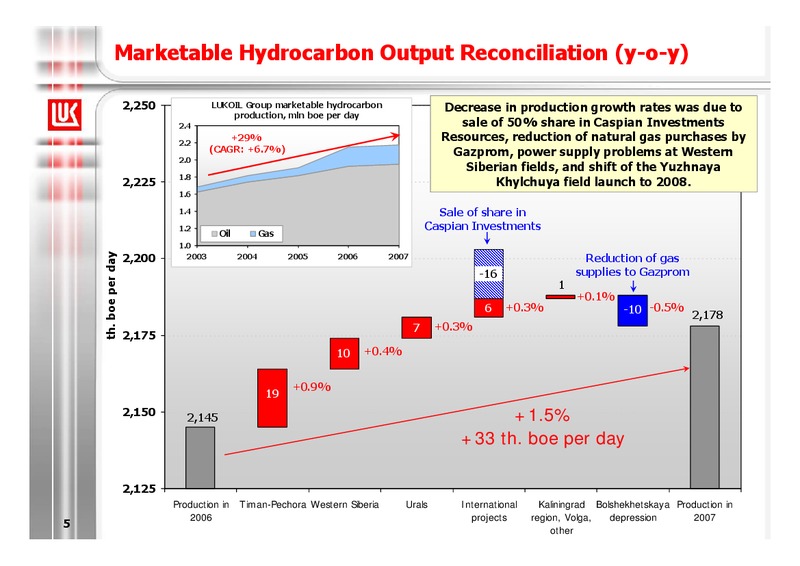
Marketable Hydrocarbon Output Reconciliation (y-o-y) 2,250 LUKOIL Group marketable hydrocarbon Decrease in production growth rates was due to production, mln boe per day 2.4 sale of 50% share in Caspian Investments 2.2 +29%…
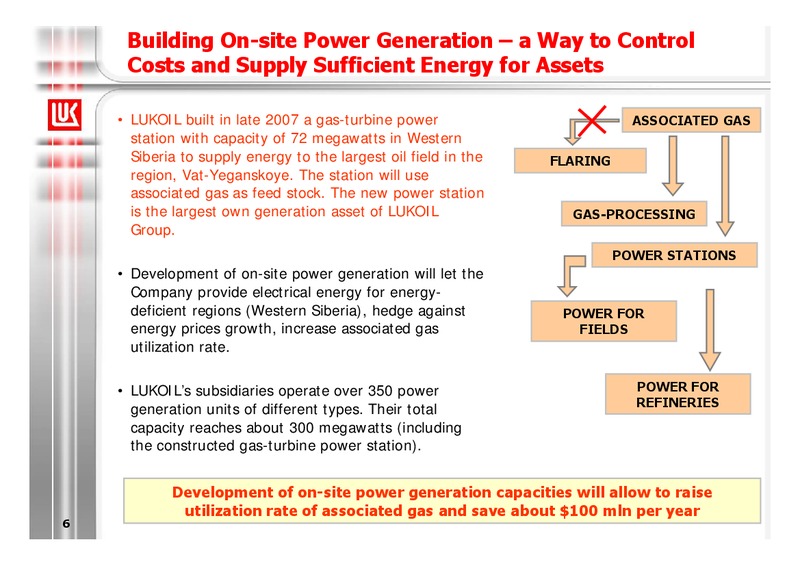
Building On-site Power Generation a Way to Control Costs and Supply Sufficient Energy for Assets LUKOIL built in late 2007 a gas-turbine power ASSOCIATED GAS station with capacity of 72 megawatts in Western Siberia to supply energy…
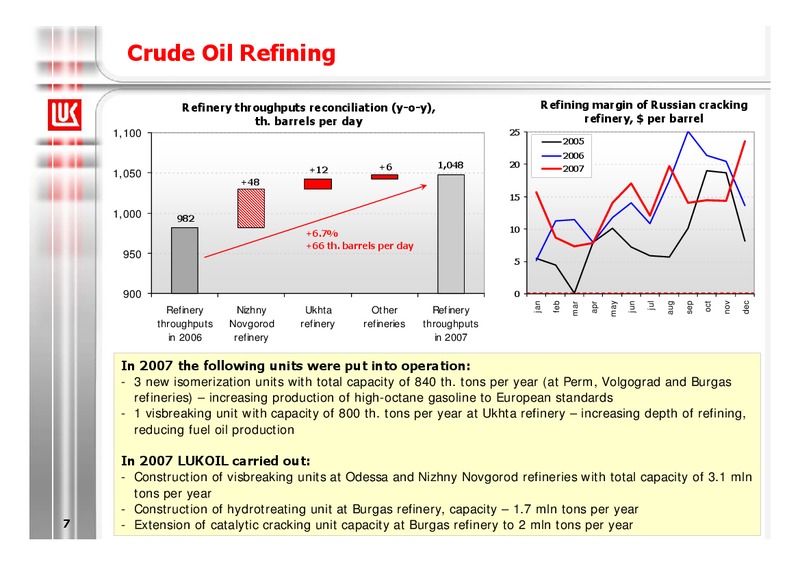
Crude Oil Refining Refinery throughputs reconciliation (y-o-y), Refining margin of Russian cracking th. barrels per day refinery, per barrel 1,100 25 2005 2006 +6 1,048 20 +12 2007 1,050 +48 15 1,000 982 10 +6.7% +66 th.…
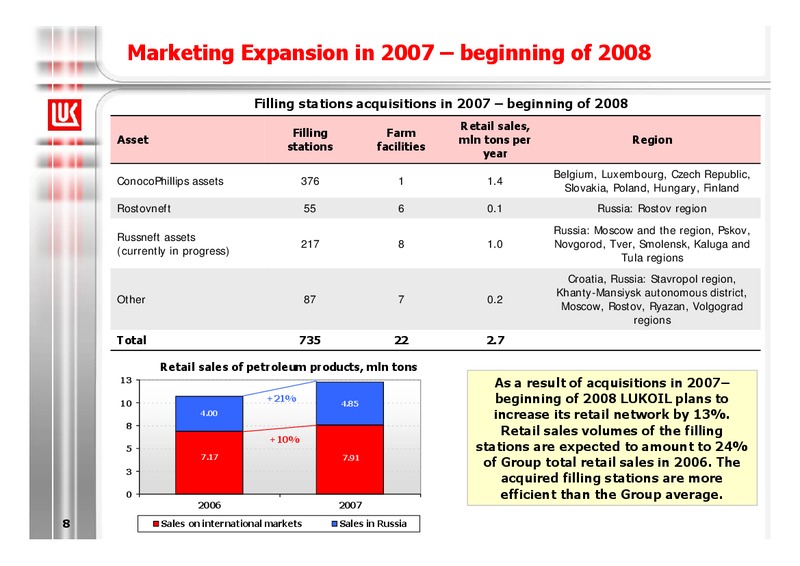
Marketing Expansion in 2007 beginning of 2008 Filling stations acquisitions in 2007 beginning of 2008 Retail sales, Filling Farm Asset mln tons per Region stations facilities year Belgium, Luxembourg, Czech Republic,…
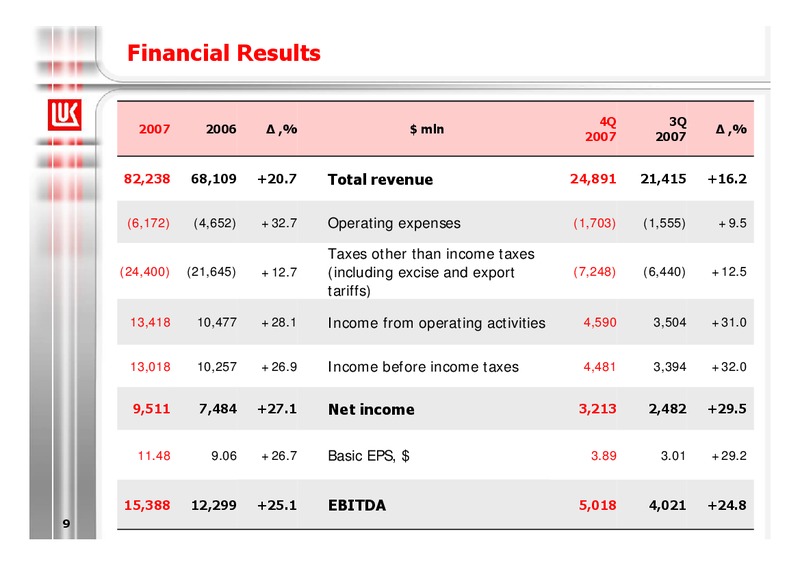
Financial Results 4Q 3Q 2007 2006 ,% mln ,% 2007 2007 82,238 68,109 +20.7 Total revenue 24,891 21,415 +16.2 (6,172) (4,652) +32.7 Operating expenses (1,703) (1,555) +9.5 Taxes other than income taxes (24,400) (21,645) +12.7…
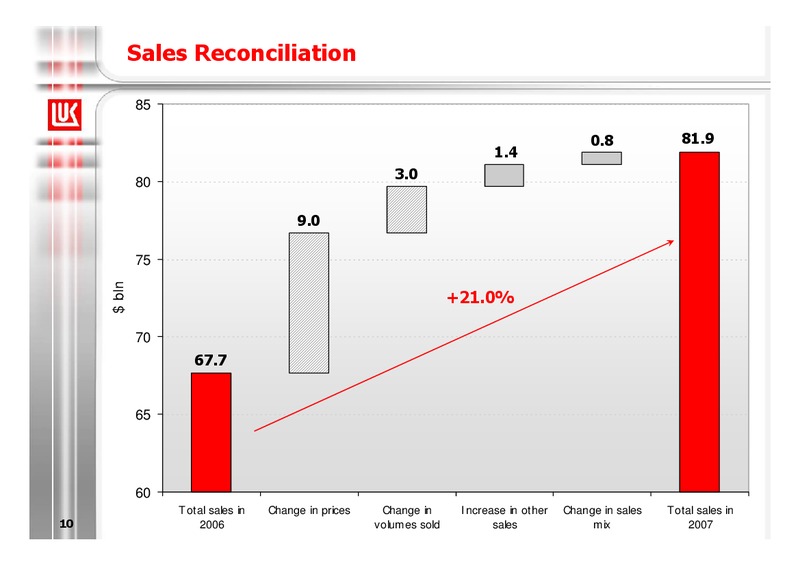
Sales Reconciliation 85 0.8 81.9 1.4 3.0 80 9.0 75 bln +21.0% 70 67.7 65 60 Total sales in Change in prices Change in Increase in other Change in sales Total sales in 10 2006 volumes sold sales mix 2007
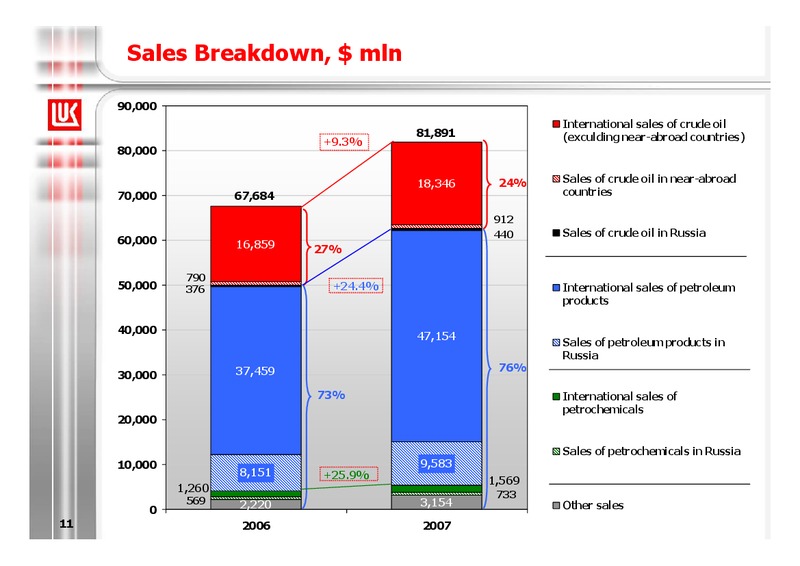
Sales Breakdown, mln 90,000 International sales of crude oil 81,891 (exculding near-abroad countries) +9.3% 80,000 18,346 24% Sales of crude oil in near-abroad 70,000 67,684 countries 912 440 Sales of crude oil in Russia…
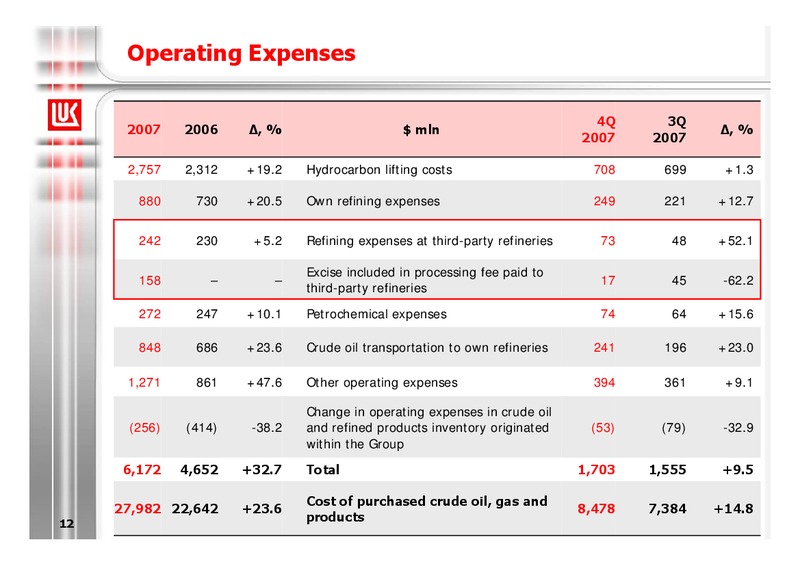
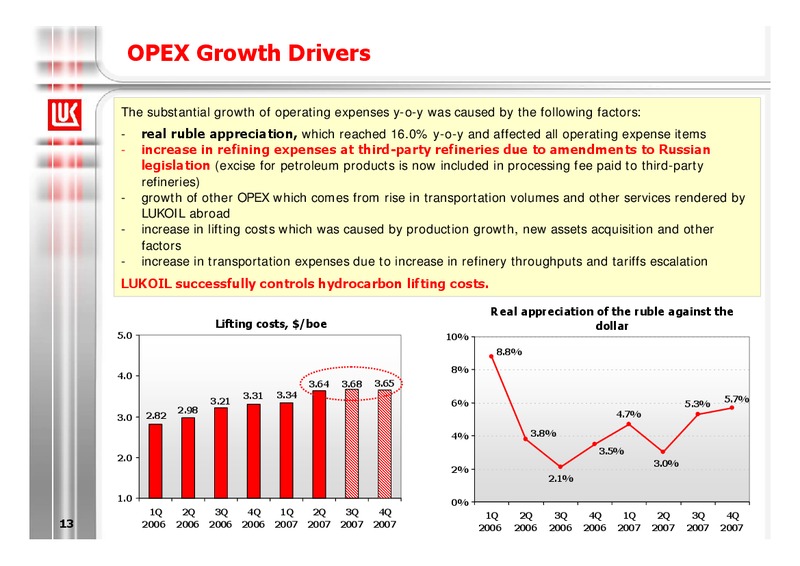
OPEX Growth Drivers The substantial growth of operating expenses y-o-y was caused by the following factors: - real ruble appreciation, which reached 16.0% y-o-y and affected all operating expense items - increase in refining expenses…
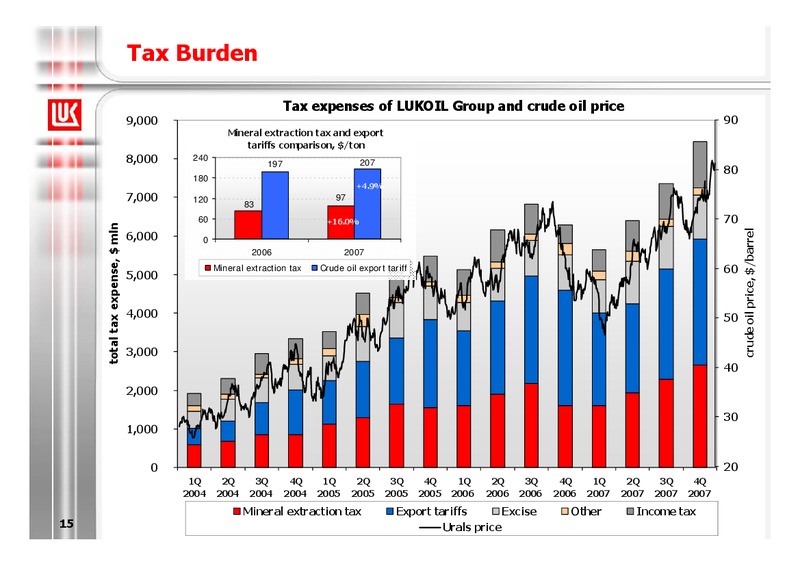
Tax Burden Tax expenses of LUKOIL Group and crude oil price 9,000 90 Mineral extraction tax and export tariffs comparison, /ton 8,000 240 207 197 80 180 +4.9% 7,000 120 97 83 60 +16.0% 70 total tax expense, mln crude…
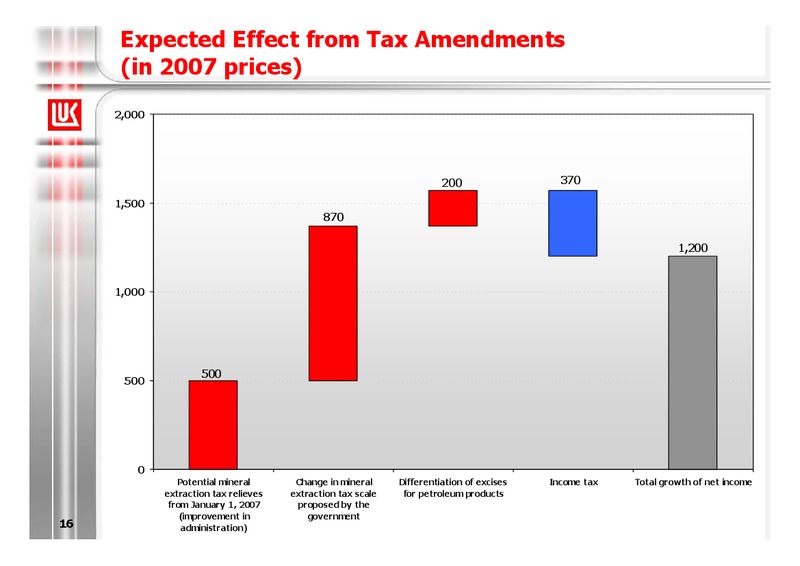
Expected Effect from Tax Amendments (in 2007 prices) 2,000 200 370 1,500 870 1,200 1,000 500 500 0 Potential mineral Change in mineral Differentiation of excises Income tax Total growth of net income…
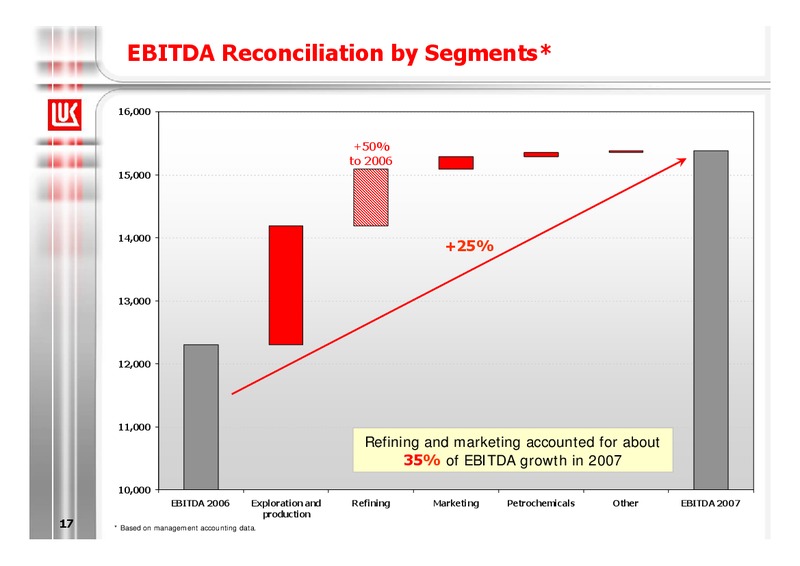
EBITDA Reconciliation by Segments* 16,000 +50% to 2006 15,000 14,000 +25% 13,000 12,000 11,000 Refining and marketing accounted for about 35% of EBITDA growth in 2007 10,000 EBITDA 2006 Exploration and…
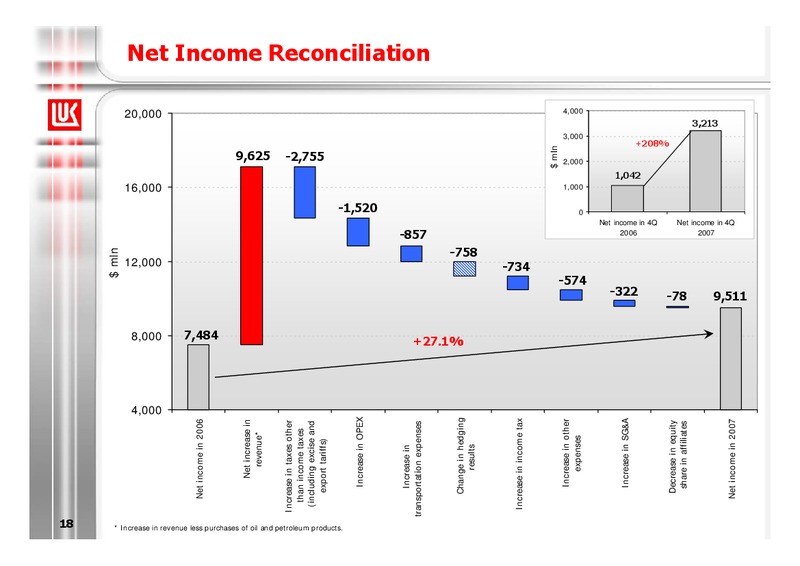
18 mln 4,000 8,000 12,000 16,000 20,000 Net income in 2006 7,484 Net increase in revenue* 9,625 Increase in taxes other than income taxes (including excise and -2,755 export tariffs) * Increase in…
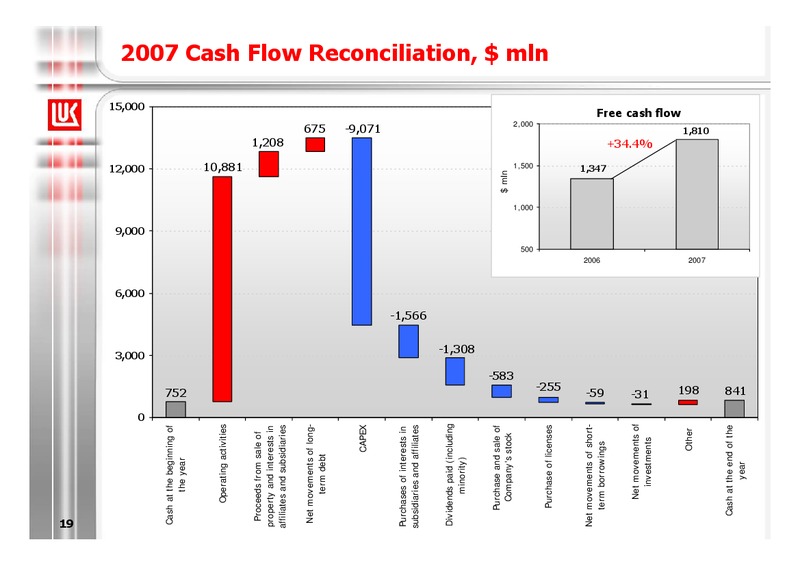
19 0 3,000 6,000 9,000 12,000 15,000 Cash at the beginning of 752 the year Operating activities 10,881 Proceeds from sale of property and interests in 1,208 affiliates and subsidiaries Net movements of…
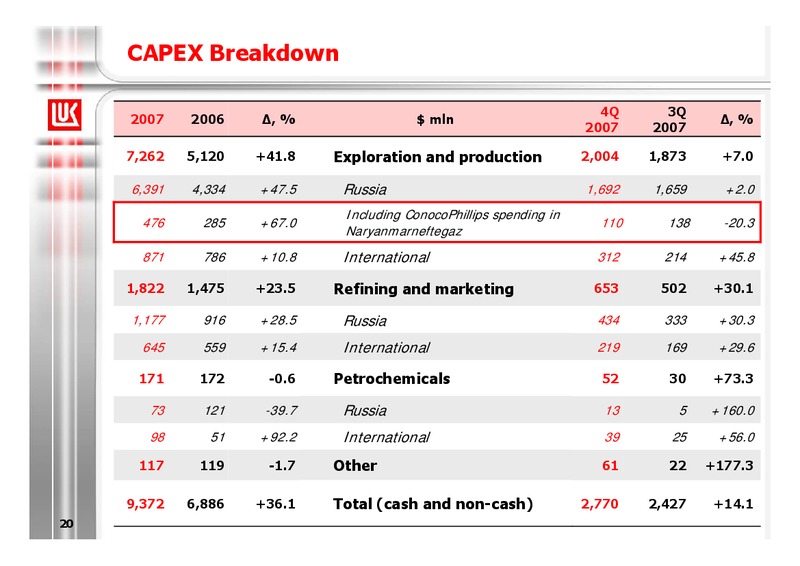
CAPEX Breakdown 4Q 3Q 2007 2006 , % mln , % 2007 2007 7,262 5,120 +41.8 Exploration and production 2,004 1,873 +7.0 6,391 4,334 +47.5 Russia 1,692 1,659 +2.0 Including ConocoPhillips spending in 476 285 +67.0 110 138 -20.3…
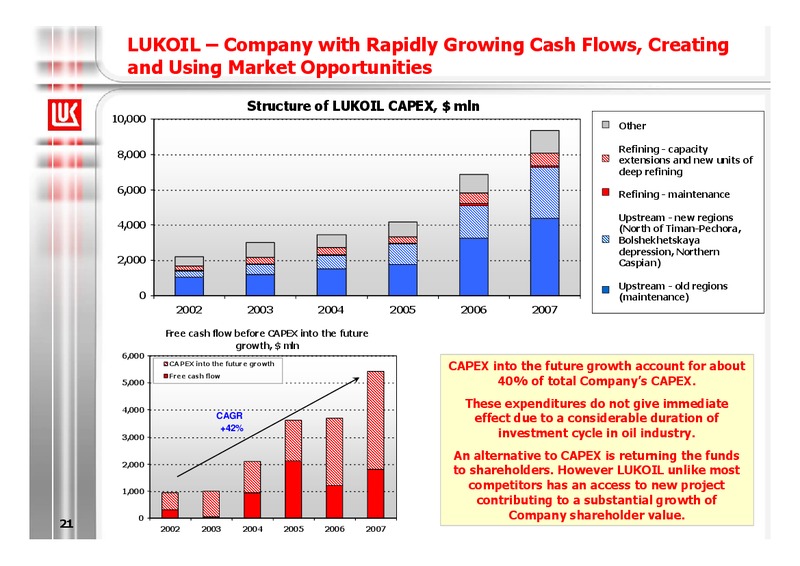
LUKOIL Company with Rapidly Growing Cash Flows, Creating and Using Market Opportunities Structure of LUKOIL CAPEX, mln 10,000 Other Refining - capacity 8,000 extensions and new units of deep refining 6,000 Refining -…
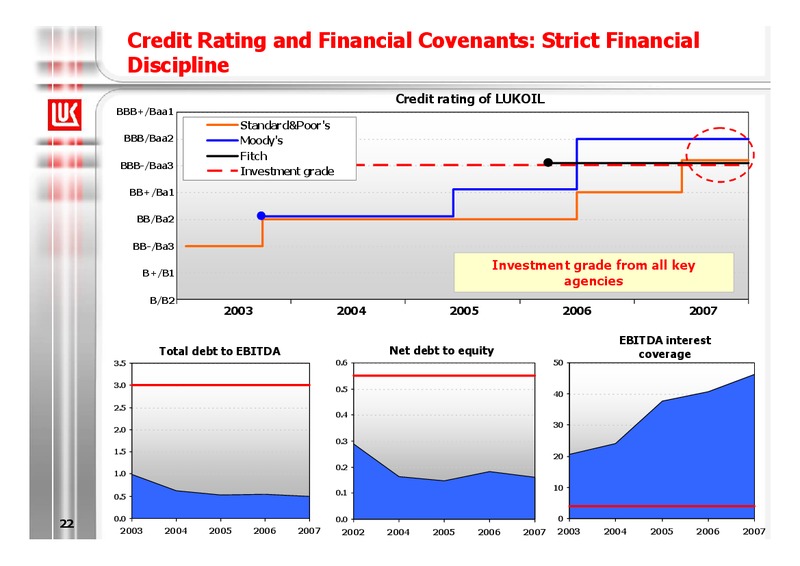
Credit Rating and Financial Covenants: Strict Financial Discipline Credit rating of LUKOIL BBB+/Baa1 Standard&Poor's BBB/Baa2 Moody's Fitch BBB-/Baa3 Investment grade BB+/Ba1 BB/Ba2 BB-/Ba3 Investment grade from all key…
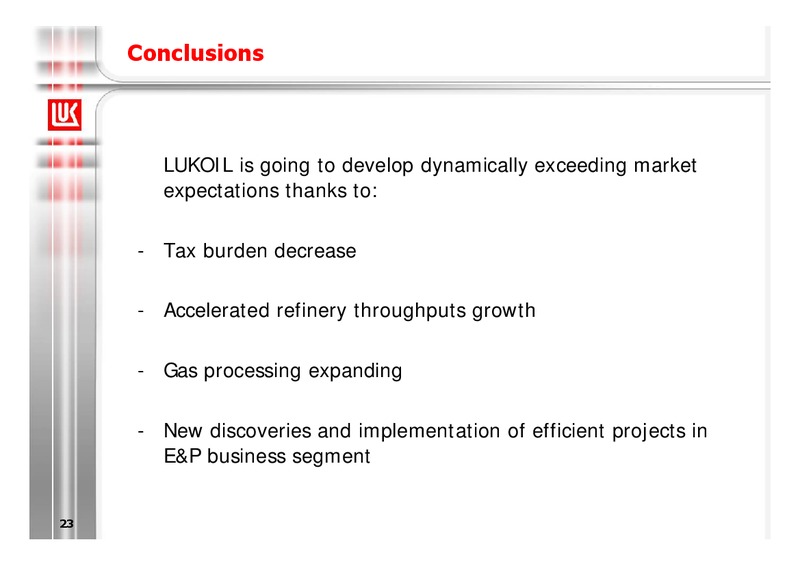
Conclusions LUKOIL is going to develop dynamically exceeding market expectations thanks to: - Tax burden decrease - Accelerated refinery throughputs growth - Gas processing expanding - New discoveries and implementation of…
 Loading...