2010 Financial Results (US GAAP) Leonid Fedun, Vice-President of LUKOIL March 2011
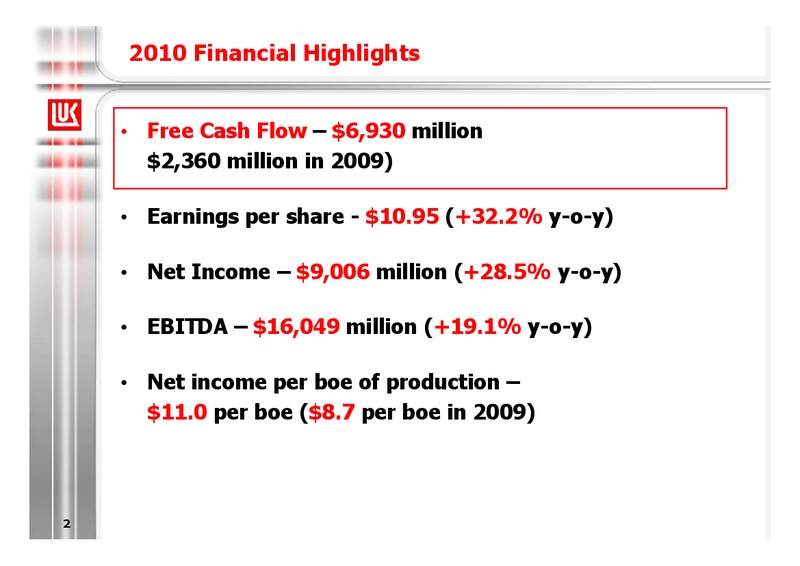
2010 Financial Highlights Free Cash Flow 6,930 million 2,360 million in 2009) Earnings per share - 10.95 (+32.2% y-o-y) Net Income 9,006 million (+28.5% y-o-y) EBITDA 16,049 million (+19.1% y-o-y) Net income per boe of…
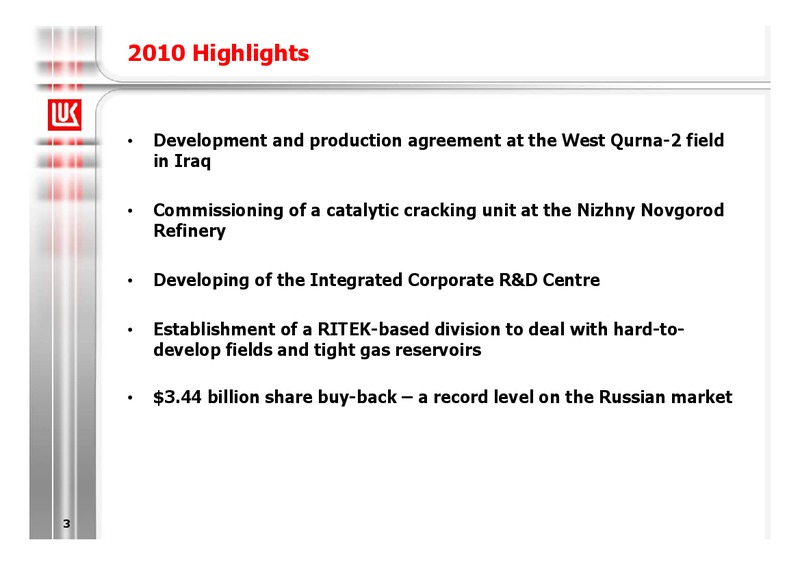
2010 Highlights Development and production agreement at the West Qurna-2 field in Iraq Commissioning of a catalytic cracking unit at the Nizhny Novgorod Refinery Developing of the Integrated Corporate R&D Centre Establishment…
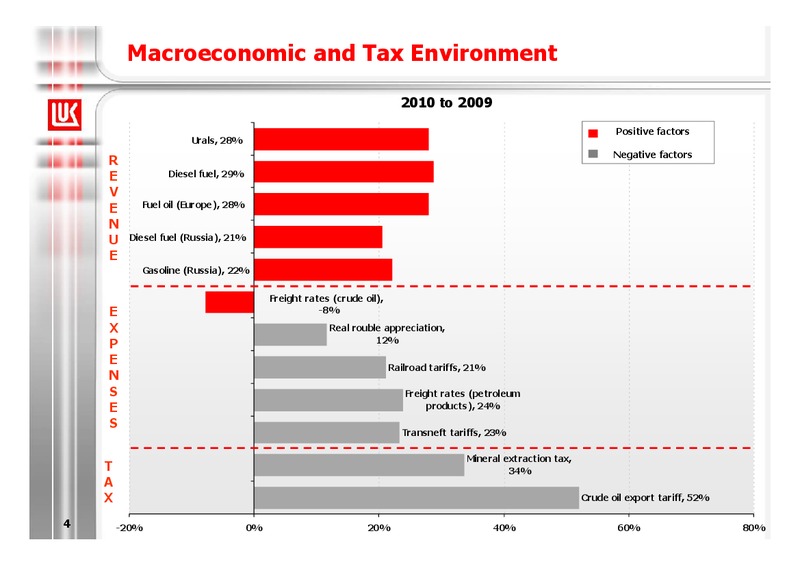
Macroeconomic and Tax Environment 2010 to 2009 Positive factors Urals, 28% Negative factors R E Diesel fuel, 29% V E Fuel oil (Europe), 28% N U Diesel fuel (Russia), 21% E Gasoline (Russia), 22% Freight rates (crude…
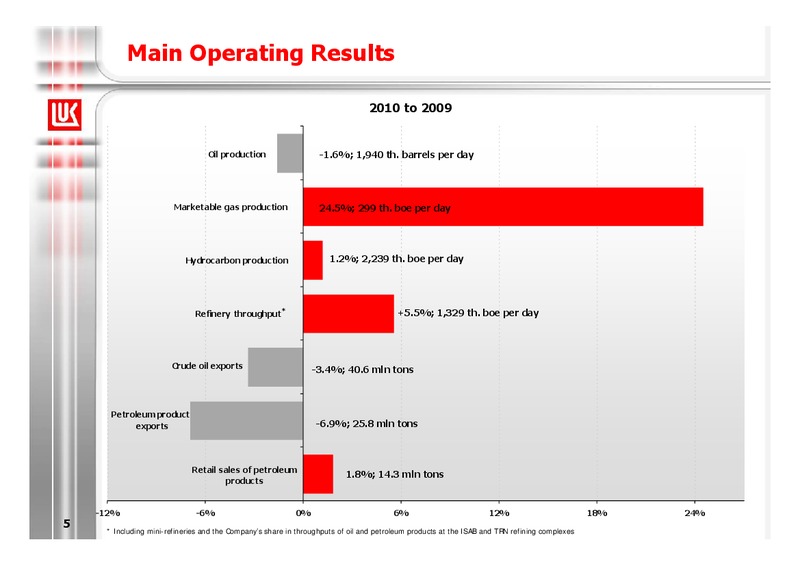
Main Operating Results 2010 to 2009 Oil production -1.6%; 1,940 th. barrels per day Marketable gas production 24.5%; 299 th. boe per day Hydrocarbon production 1.2%; 2,239 th. boe per day Refinery throughput * +5.5%;…
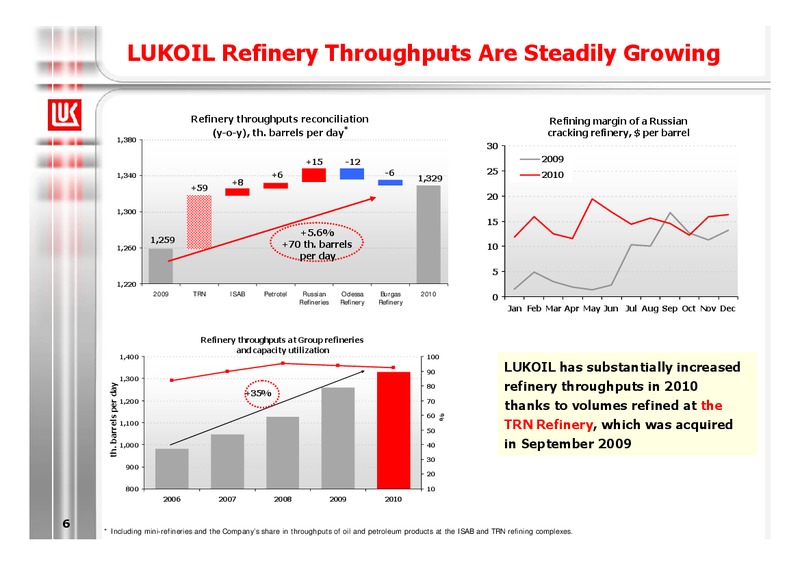
LUKOIL Refinery Throughputs Are Steadily Growing Refinery throughputs reconciliation Refining margin of a Russian (y-o-y), th. barrels per day* cracking refinery, per barrel 1,380 30 +15 -12 2009 1,340 +6 -6 25 2010 +8 1,329…
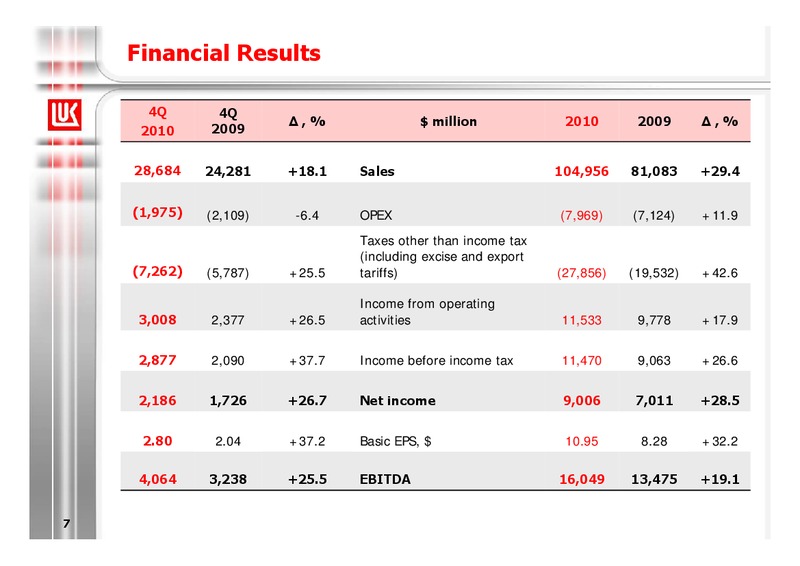
Financial Results 4Q 4Q ,% million 2010 2009 ,% 2010 2009 28,684 24,281 +18.1 Sales 104,956 81,083 +29.4 (1,975) (2,109) -6.4 OPEX (7,969) (7,124) +11.9 Taxes other than income tax (including excise and export (7,262)…
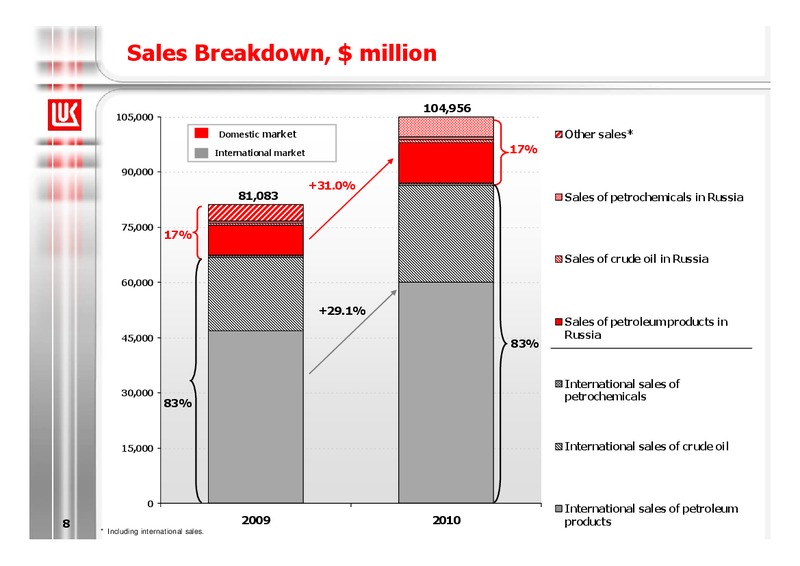
Sales Breakdown, million 104,956 105,000 Domestic market Other sales* International market 17% 90,000 +31.0% 81,083 Sales of petrochemicals in Russia 75,000 17% Sales of crude oil in Russia 60,000 +29.1% Sales of…
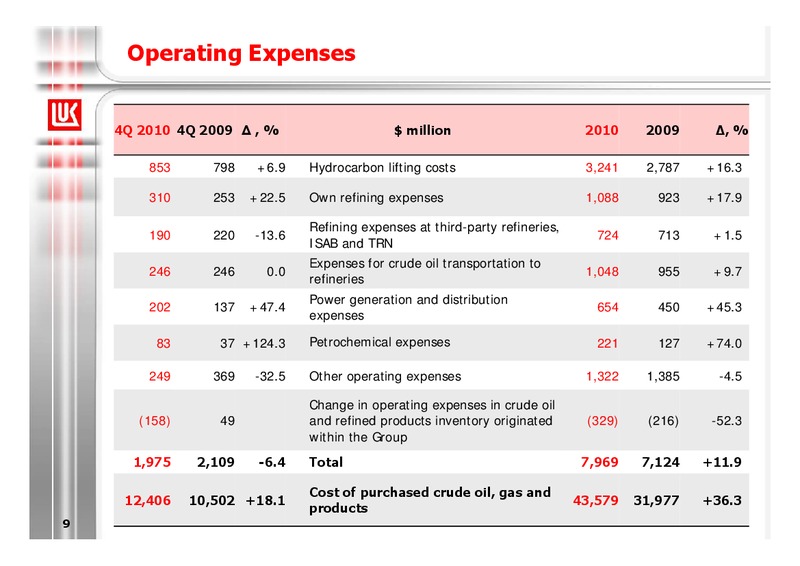
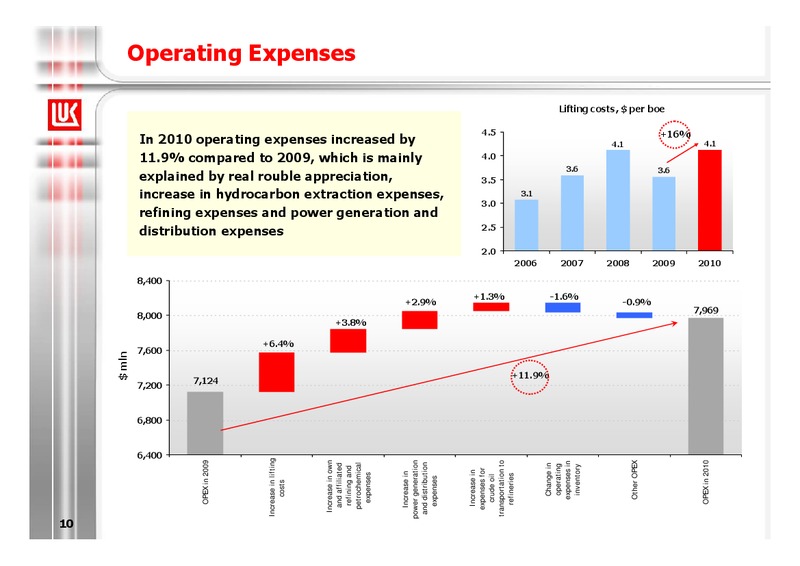
Operating Expenses Lifting costs, per boe 4.5 +16% In 2010 operating expenses increased by 4.1 4.1 11.9% compared to 2009, which is mainly 4.0 3.6 3.6 explained by real rouble appreciation, 3.5 increase in hydrocarbon…
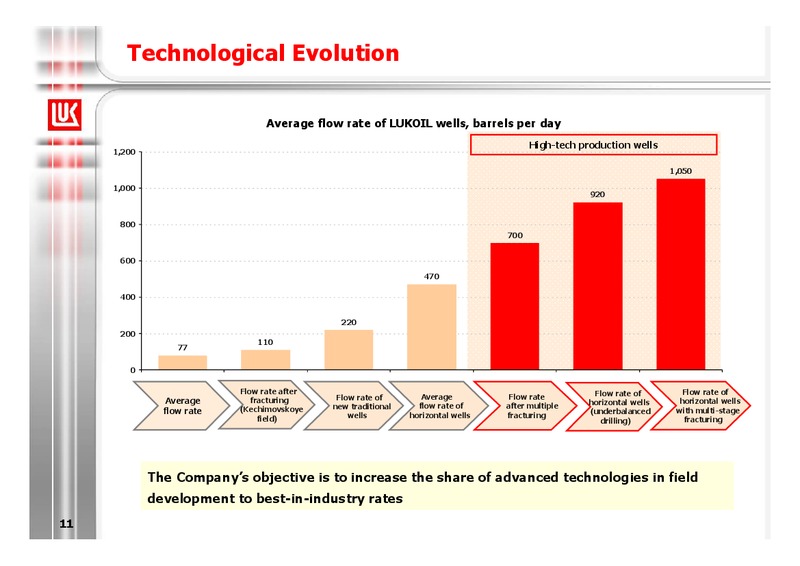
Technological Evolution Average flow rate of LUKOIL wells, barrels per day High-tech production wells 1,200 1,050 1,000 920 800 700 600 470 400 220 200 110 77 0 Flow rate after Flow rate of Flow rate of…
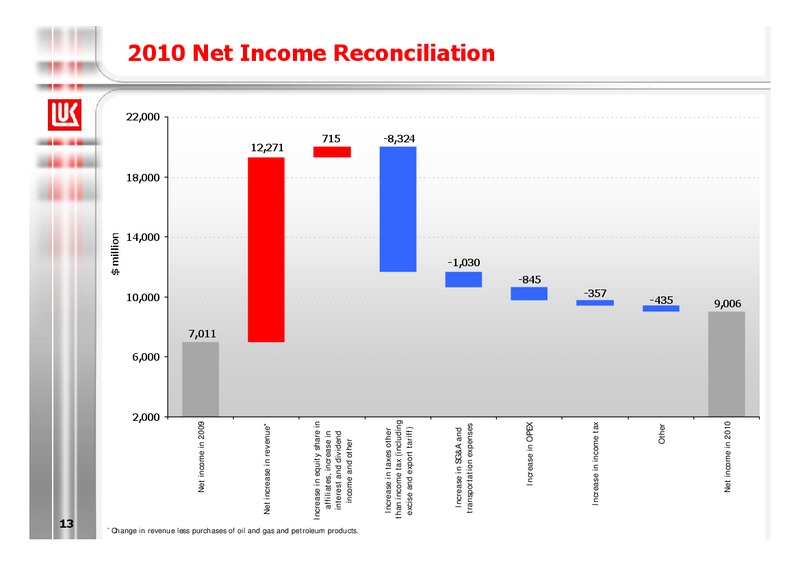
* 13 million 2,000 6,000 10,000 14,000 18,000 22,000 Net income in 2009 7,011 Net increase in revenue* 12,271 Increase in equity share in affiliates, increase in 715 interest and dividend income and…
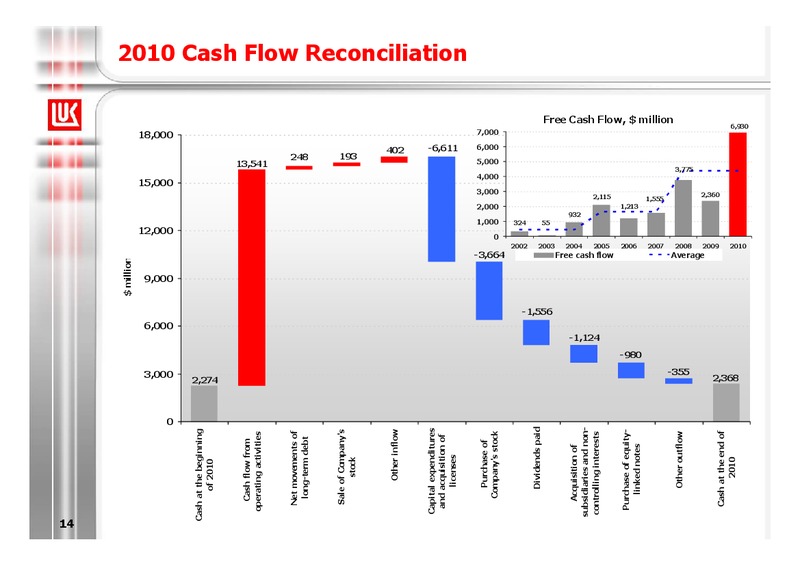
14 million 0 3,000 6,000 9,000 12,000 15,000 18,000 Cash at the beginning of 2010 2,274 Cash flow from operating activities 13,541 Net movements of 248 long-term debt Sale of Company's stock…
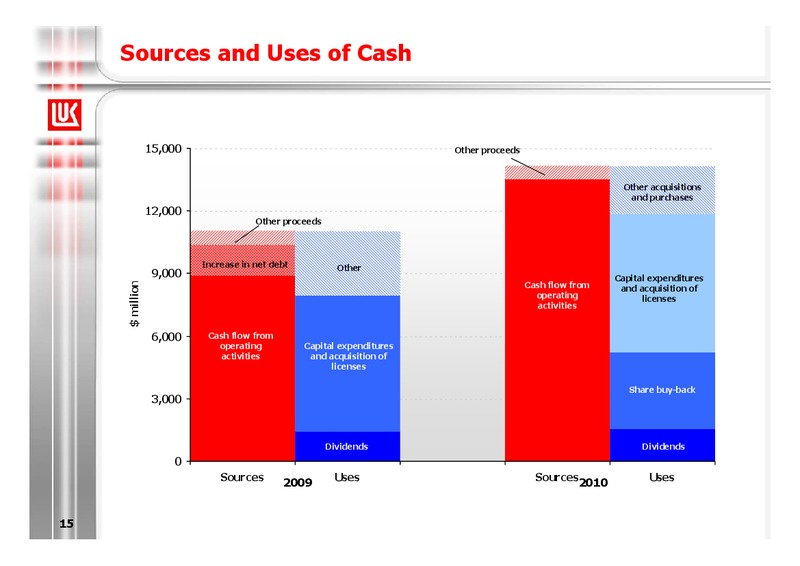
Sources and Uses of Cash 15,000 Other proceeds Other acquisitions and purchases 12,000 Other proceeds Increase in net debt Other 9,000 Capital expenditures Cash flow from million and acquisition of operating…
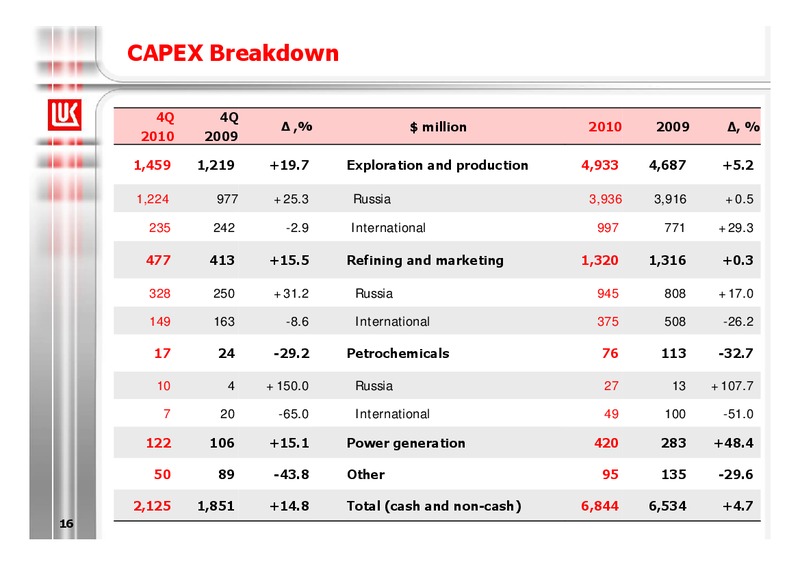
CAPEX Breakdown 4Q 4Q ,% million 2010 2009 , % 2010 2009 1,459 1,219 +19.7 Exploration and production 4,933 4,687 +5.2 1,224 977 +25.3 Russia 3,936 3,916 +0.5 235 242 -2.9 International 997 771 +29.3 477 413 +15.5 Refining…
Conclusion Financial and Investment Policy Highlights: - Investment policy focuses on the development of E&P segment, increase of E&P share in total CAPEX - Continuing modernization of Russian refineries under new tax regime -…
 Loading...