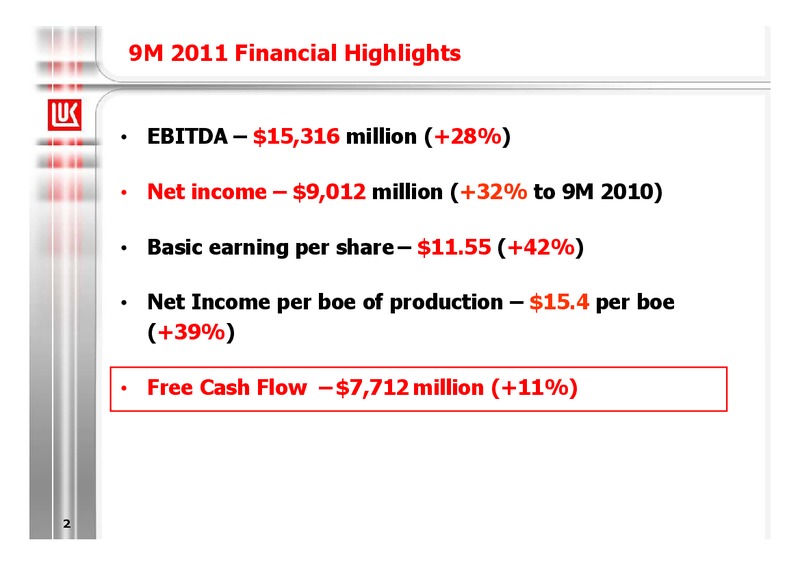
9M 2011 Financial Highlights EBITDA 15,316 million (+28%) Net income 9,012 million (+32% to 9M 2010) Basic earning per share 11.55 (+42%) Net Income per boe of production 15.4 per boe (+39%) Free Cash Flow 7,712 million…
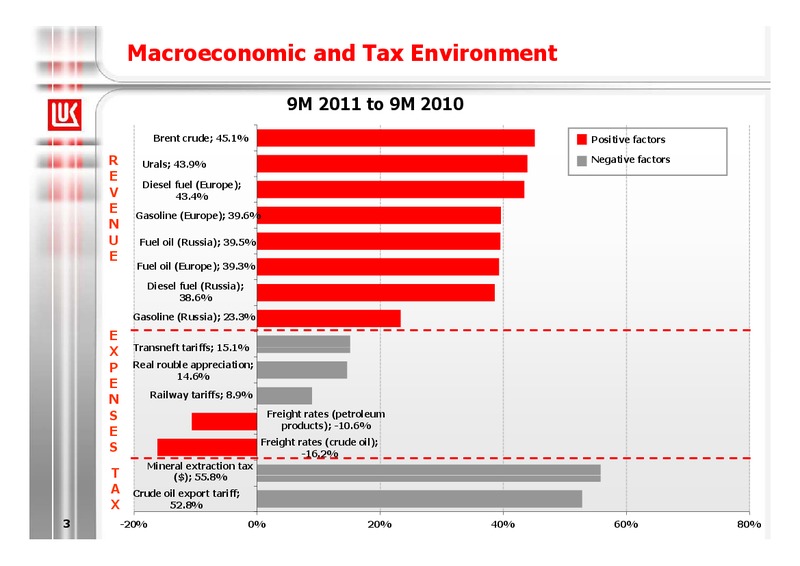
Macroeconomic and Tax Environment 9M 2011 to 9M 2010 Brent crude; 45.1% Positive factors R Urals; 43.9% Negative factors E Diesel fuel (Europe); V 43.4% E Gasoline (Europe); 39.6% N U Fuel oil (Russia); 39.5% E Fuel oil…
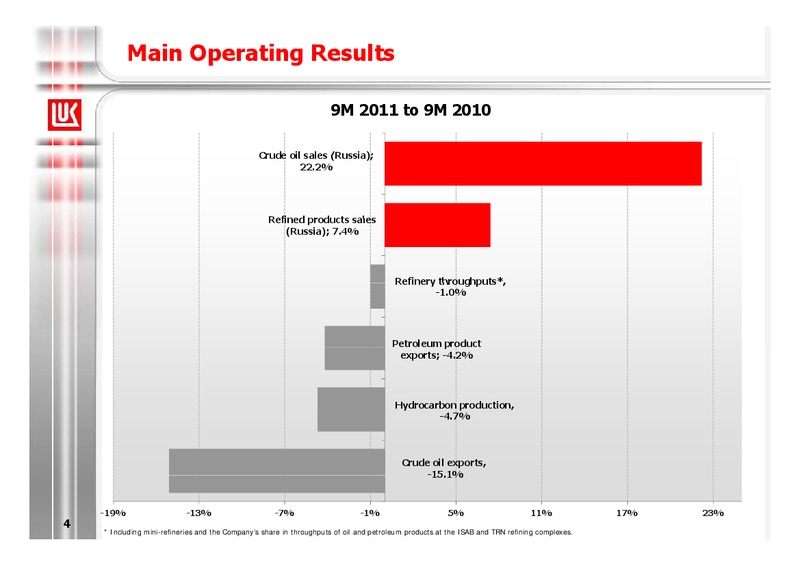
Main Operating Results 9M 2011 to 9M 2010 Crude oil sales (Russia); 22.2% Refined products sales (Russia); 7.4% Refinery throughputs*, throughputs , -1.0% Petroleum p product exports; -4.2% Hydrocarbon…
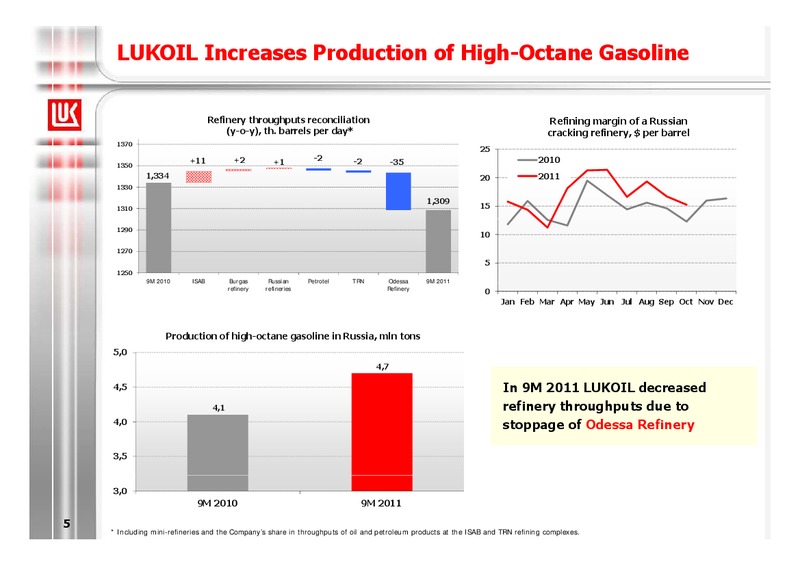
LUKOIL Increases Production of High-Octane Gasoline Refinery throughputs reconciliation Refining margin of a Russian (y-o-y), th. barrels per day* cracking refinery, per barrel 1370 25 +11 +2 -2 -2 -35 2010 1350 +1 1,334 20…
Sharp Increase in Income Tax One-Off Event Income before tax and income tax, million 4,070 LUKOIL subsidiaries in Russia increased accounts 4 000 3,508 receivable and issued loans nominated in US dollars Income tax without 3 500…
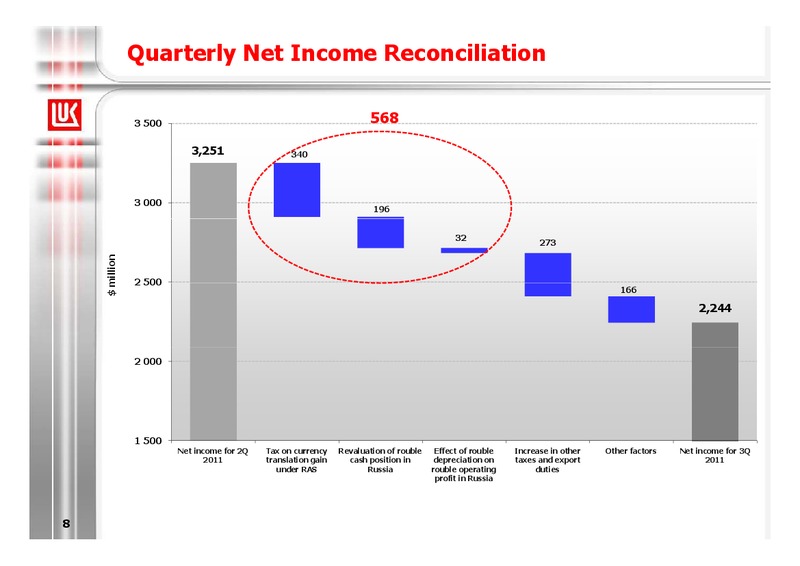
Quarterly Net Income Reconciliation 3 500 568 3,251 340 3 000 196 32 273 million 2 500 m 166 2,244 2 000 1 500 Net income for 2Q Tax on currency Revaluation of rouble Effect of rouble Increase in…
12 mln * 2 500 5 000 7 500 10 000 12 500 15 000 17 500 20 000 0 Net inc come in 9M 2010 0 6,820 Net incrrease in revenue e 10,773 Net loss attributable to 91 noncontrrolling interests Change…
13 mln 3 000 6 000 9 000 12 000 15 000 0 Cash at the begin ninning of 2011 2,368 Cash flow from operating es activitie 13,299 Acquisition of su ubsidiaries and non-conttrolling interests (inc cluding…
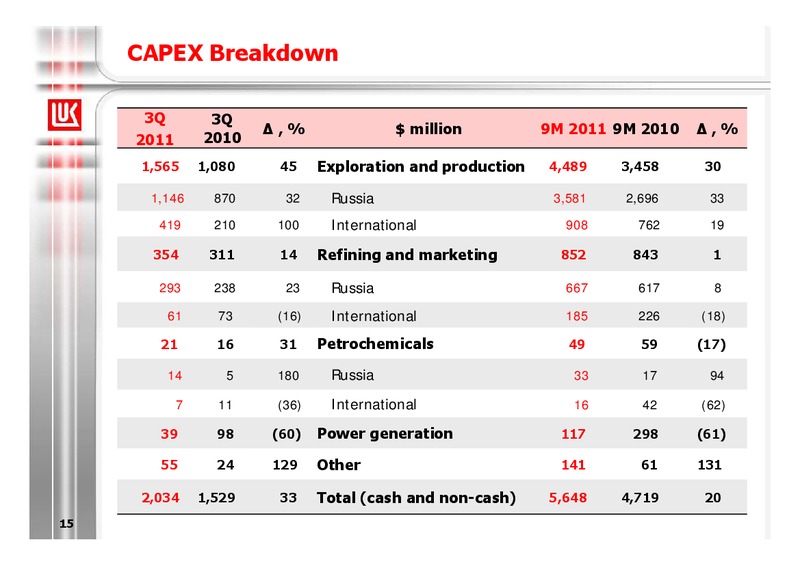
CAPEX Breakdown 3Q 3Q ,% million 9M 2011 9M 2010 ,% 2011 2010 1,565 1,080 45 Exploration and production 4,489 3,458 30 1,146 870 32 Russia 3,581 2,696 33 419 210 100 I International i l 908 762 19 354 311 14 Refining and…
Robust Financial Position Total debt and net debt, bln 12,000 10,653 -9% 9,719 10 000 10,000 8,000 6,576 5,278 LUKOIL net debt decreased by 1.3 bln 6,000 in 9M 2011 (-25%) 4,000 2,000 4,077 4,441 0 30.06.2011…
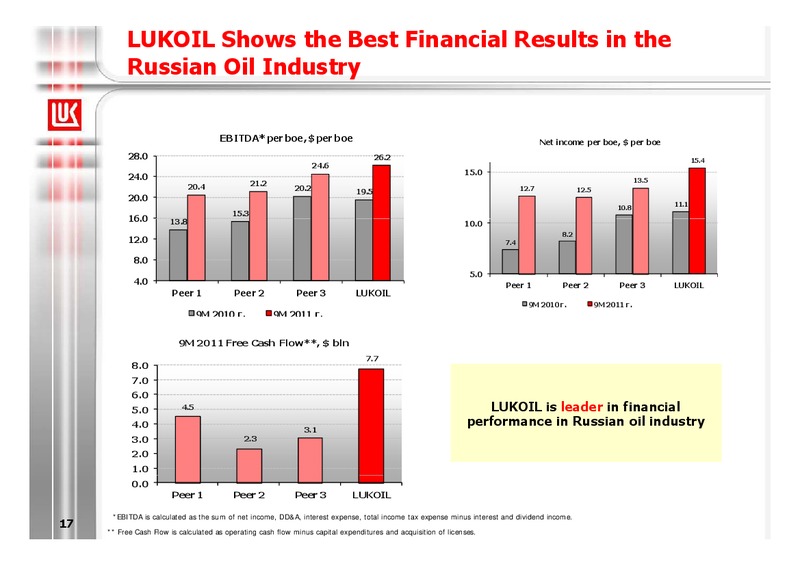
LUKOIL Shows the Best Financial Results in the Russian Oil Industry EBITDA* per boe, per boe Net income per boe, per boe 28 0 28.0 26 2 26.2 15.4 24.6 15.0 24.0 13.5 21.2 20.4 20.2 12.7 12.5 19.5 20.0 10.8 11.1 15.3 16 0…
Robust Competitive Position in the Industry Net income per boe, per boe Lifting costs per boe, per boe 15 40 35 12 30 25 9 20 15 6 10 3 5 0 2003 2004 2005 2006 2007 2008 2009 2010 9M 2011 0 2006 2007 2008 2009 2010…
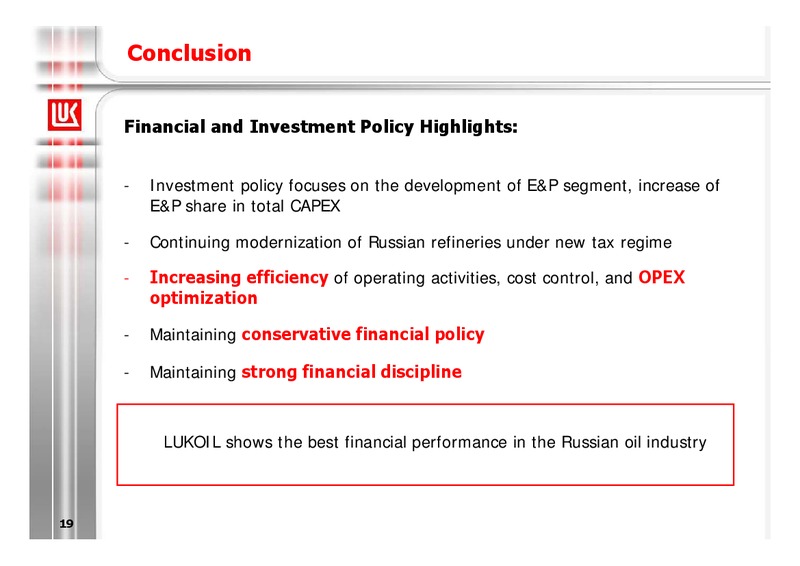
Conclusion Financial and Investment Policy Highlights: - Investment policy focuses on the development of E&P segment, increase of E&P share in total CAPEX - Continuing modernization of Russian refineries under new tax regime -…
 Loading...