4th quarter and full year 2010 Helge Lund, President and CEO London, 9 February 2011
2010: High profits strategic progress Strategic progress and active portfolio management Strong and improving HSE results Challenging operations second half Strong cash flow and financials Proposed increase in dividend
Continued safety improvement Serious incident frequency (Number of incidents per million work hours) 3 2 1 0 2005 2006 2007 2008 2009 2010
Production High capacity utilization first half year Equity production mboe/d Second half constrained by: 2102 1962 1957 1945 Turnarounds 1888 Production permits 1552 Operational issues 760 885 809 533 839 766 1202 1217…
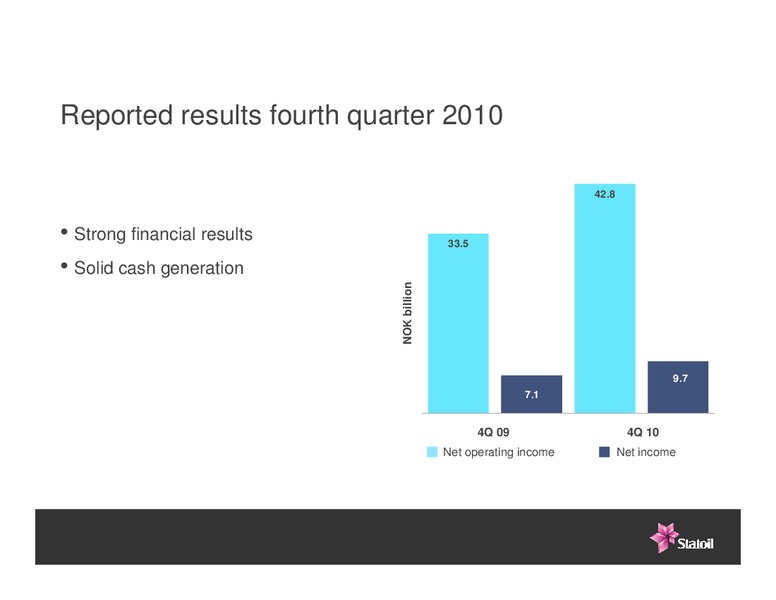
Reported results fourth quarter 2010 42.8 Strong financial results 33.5 Solid cash generation NOK billion 4,0 9.7 7.1 1Q09 4Q 09 1Q10 4Q 10 Net operating income Net income
Adjusted earnings by Business Area NOK bn. 4Q 2010 2010 Adjusted earnings Adjusted earnings Business area pre tax after tax pre tax after tax E&P Norway 32.0 8.3 111.9 29.1 International E&P 4.1 0.9 13.9 6.2 Natural Gas 3.5 0.8 13.5…
Around 3% production growth* towards 2012 3% CAGR Strong resource base Decline as expected Important IOR contribution Solid capacity under way 2010 2011 2012 * CAGR= Compound annual growth rate
Summary Strategic progress and active portfolio management Strong and improving HSE results Challenging operations second half Strong cash flow and financials Proposed increase in dividend
 Loading...