1Q 2009 Financial Results (US GAAP) Leonid Fedun, Vice-President of LUKOIL June 2009
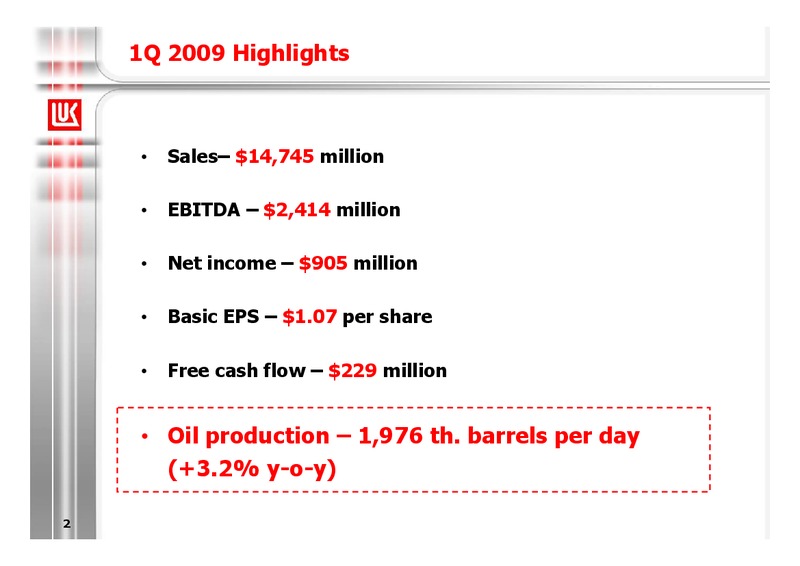
1Q 2009 Highlights Sales 14,745 million EBITDA 2,414 million Net income 905 million Basic EPS 1.07 per share Free cash flow 229 million Oil production 1,976 th. barrels per day (+3.2% y-o-y) 2
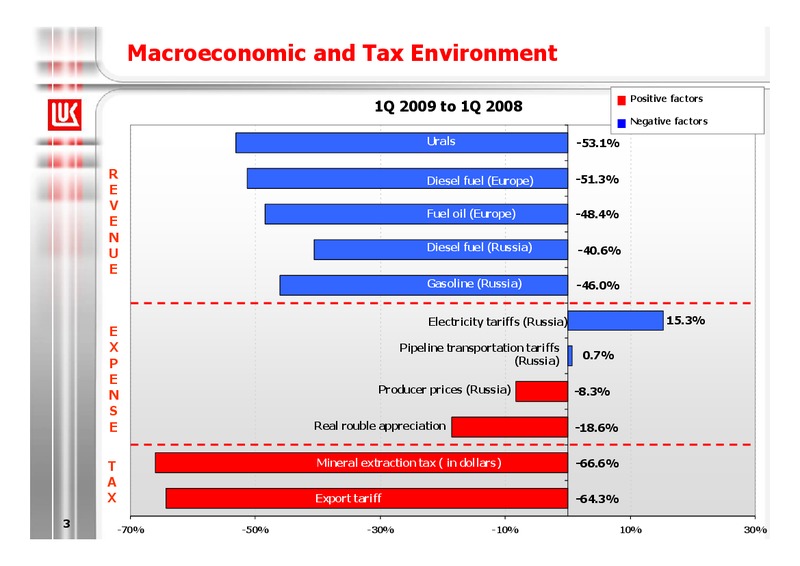
Macroeconomic and Tax Environment Positive factors 1Q 2009 to 1Q 2008 Negative factors Urals -53.1% R Diesel fuel (Europe) -51.3% E V Fuel oil (Europe) -48.4% E N Diesel fuel (Russia) -40.6% U E Gasoline (Russia)…
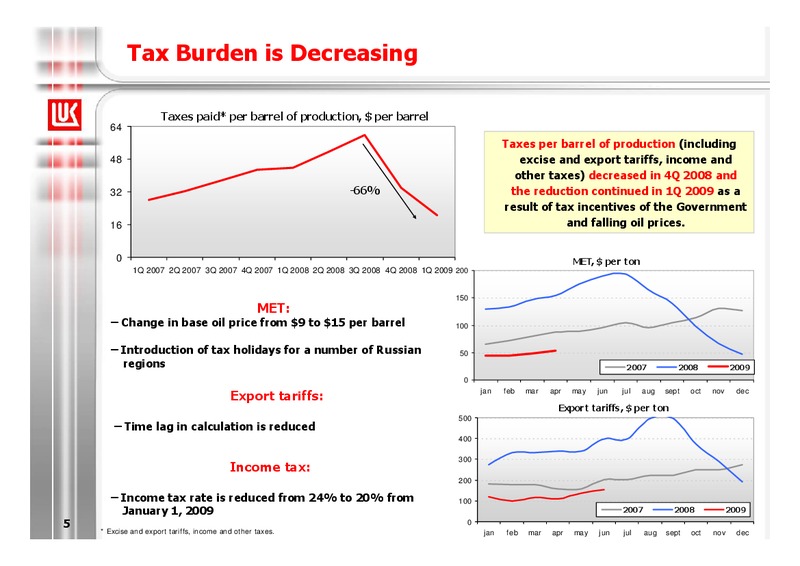
Tax Burden is Decreasing Taxes paid* per barrel of production, per barrel 64 Taxes per barrel of production (including 48 excise and export tariffs, income and other taxes) decreased in 4Q 2008 and 32 -66% the reduction continued…
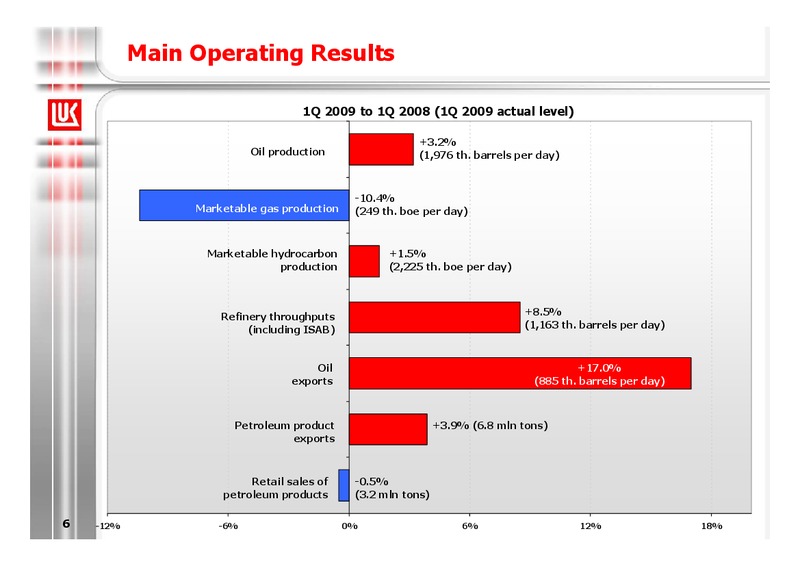
Main Operating Results 1Q 2009 to 1Q 2008 (1Q 2009 actual level) +3.2% Oil production (1,976 th. barrels per day) -10.4% Marketable gas production (249 th. boe per day) Marketable hydrocarbon +1.5% production (2,225 th.…
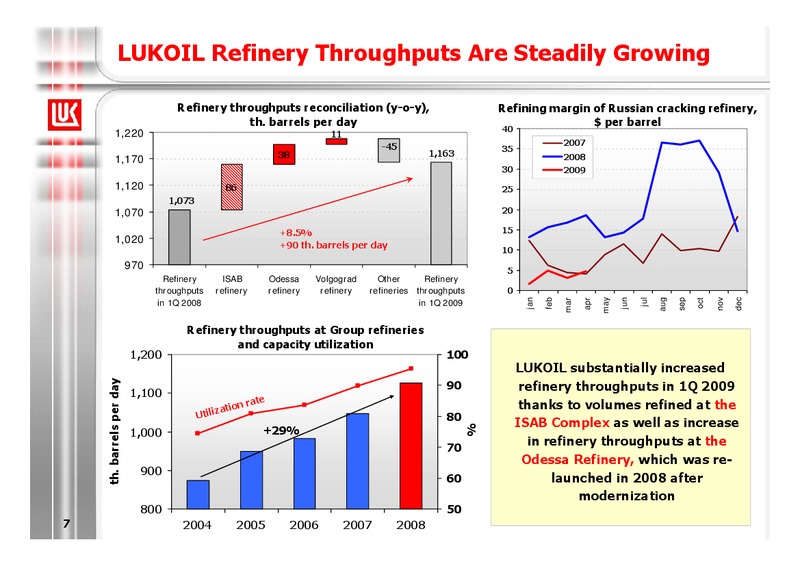
LUKOIL Refinery Throughputs Are Steadily Growing Refinery throughputs reconciliation (y-o-y), Refining margin of Russian cracking refinery, th. barrels per day per barrel 40 1,220 11 -45 2007 35 38 1,163 2008 1,170 30 2009…
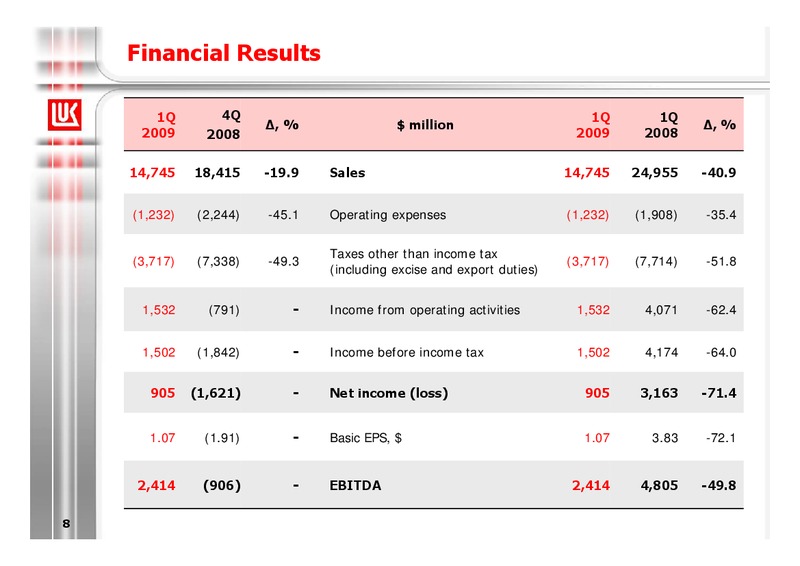
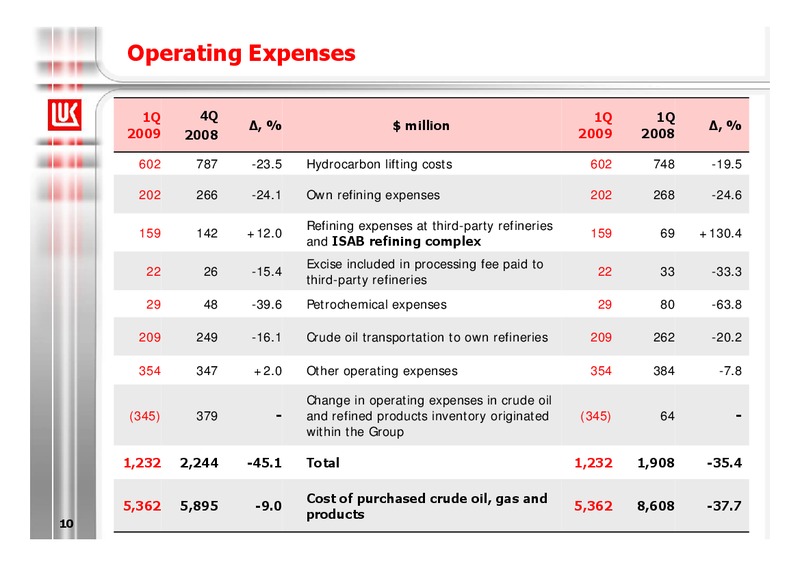
Financial Results 1Q 4Q 1Q 1Q , % million , % 2009 2008 2009 2008 14,745 18,415 -19.9 Sales 14,745 24,955 -40.9 (1,232) (2,244) -45.1 Operating expenses (1,232) (1,908) -35.4 Taxes other than income tax (3,717) (7,338) -49.3…
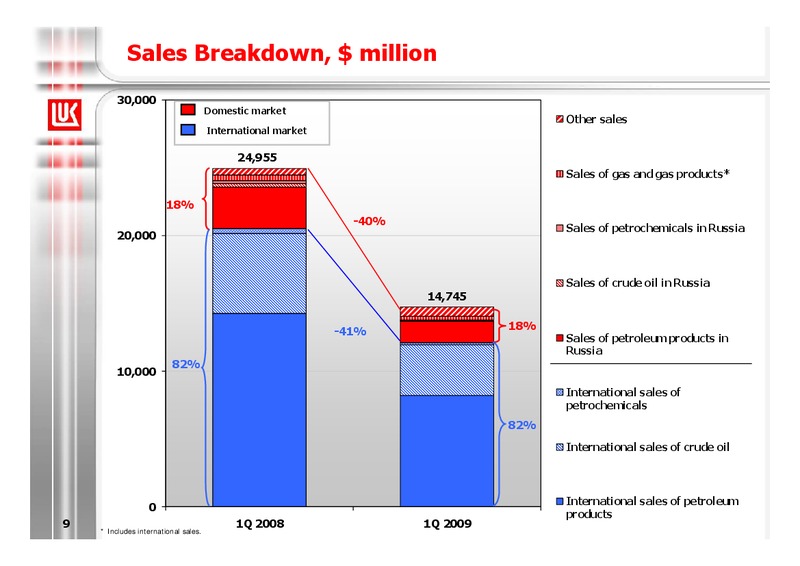
Sales Breakdown, million 30,000 Domestic market Other sales International market 24,955 Sales of gas and gas products* 18% -40% Sales of petrochemicals in Russia 20,000 Sales of crude oil in Russia 14,745 18% -41%…
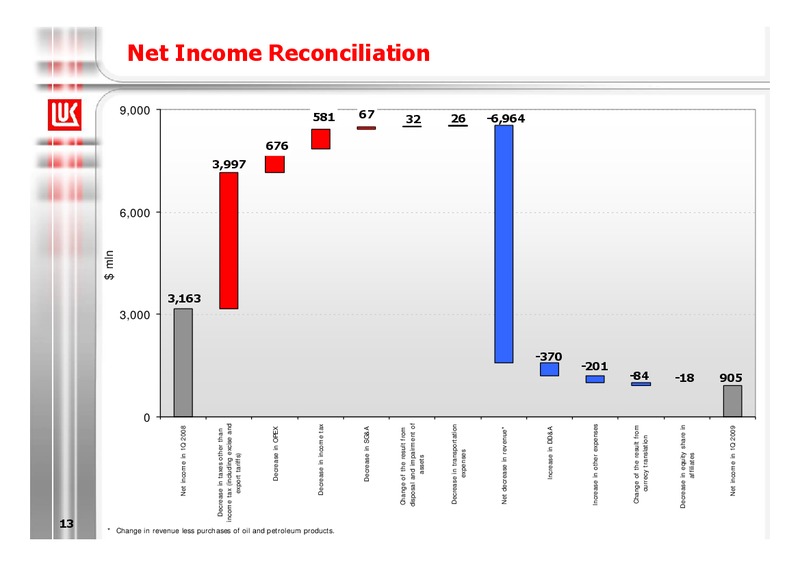
13 mln 0 3,000 6,000 9,000 Net income in 1Q 2008 3,163 Decrease in taxes other than income tax (including excise and export tariffs) 3,997 Decrease in OPEX 676 Decrease in income tax 581 * Change in…
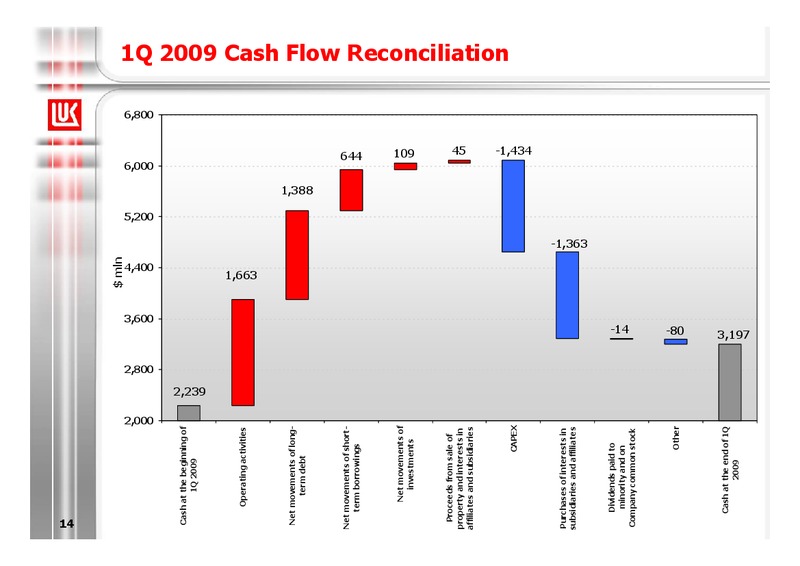
14 mln 2,000 2,800 3,600 4,400 5,200 6,000 6,800 Cash at the beginning of 1Q 2009 2,239 Operating activities 1,663 Net movements of long- term debt 1,388 Net movements of short- term borrowings…
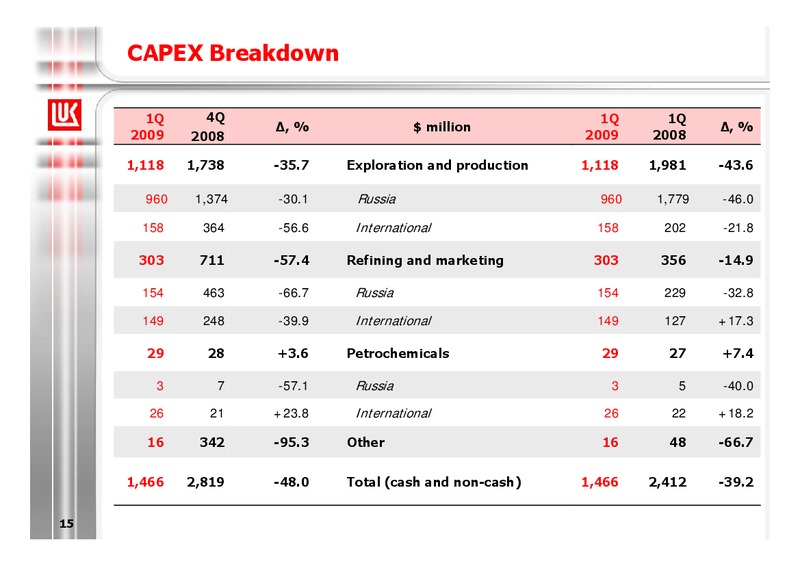
CAPEX Breakdown 1Q 4Q 1Q 1Q , % million , % 2009 2008 2009 2008 1,118 1,738 -35.7 Exploration and production 1,118 1,981 -43.6 960 1,374 -30.1 Russia 960 1,779 -46.0 158 364 -56.6 International 158 202 -21.8 303 711 -57.4…
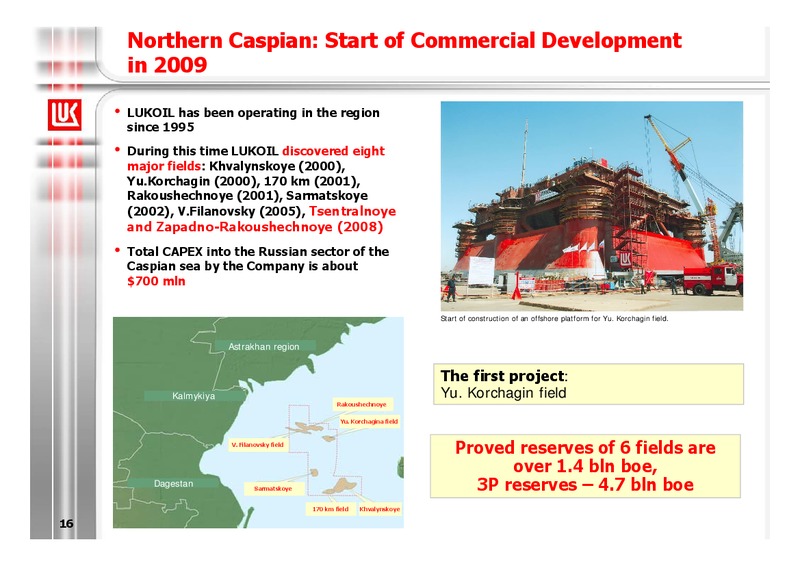
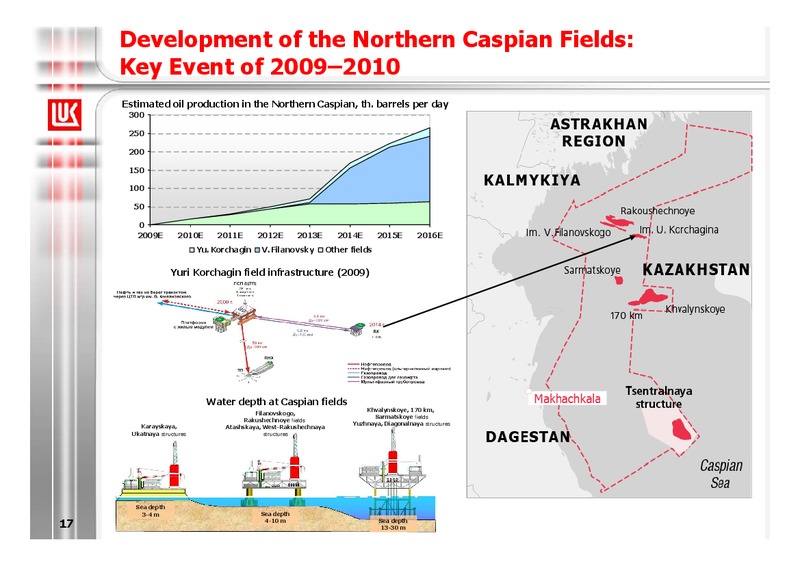
Northern Caspian: Start of Commercial Development in 2009 LUKOIL has been operating in the region since 1995 During this time LUKOIL discovered eight major fields: Khvalynskoye (2000), Yu.Korchagin (2000), 170 km (2001),…
Development of the Northern Caspian Fields: Key Event of 20092010 Estimated oil production in the Northern Caspian, th. barrels per day 300 250 200 150 100 50 0 2009E 2010E 2011E 2012E 2013E 2014E 2015E 2016E Yu.…
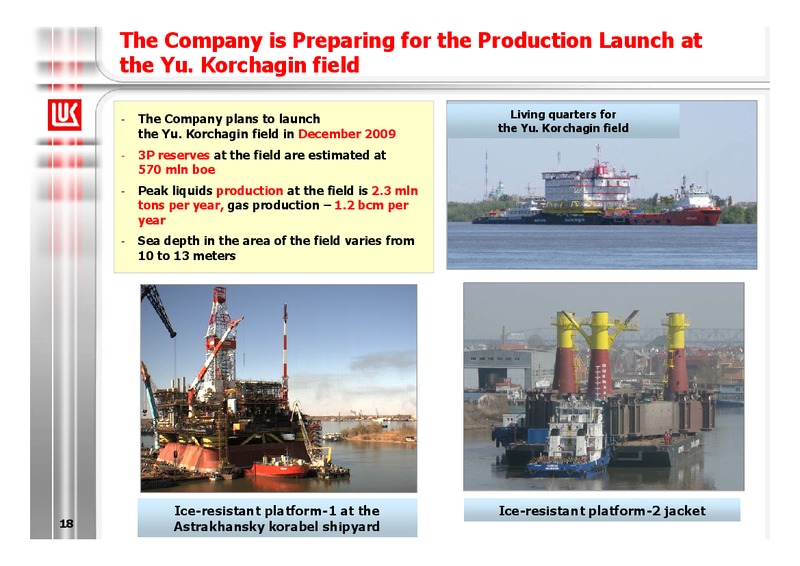
The Company is Preparing for the Production Launch at the Yu. Korchagin field - The Company plans to launch Living quarters for the Yu. Korchagin field the Yu. Korchagin field in December 2009 - 3P reserves at the field are…
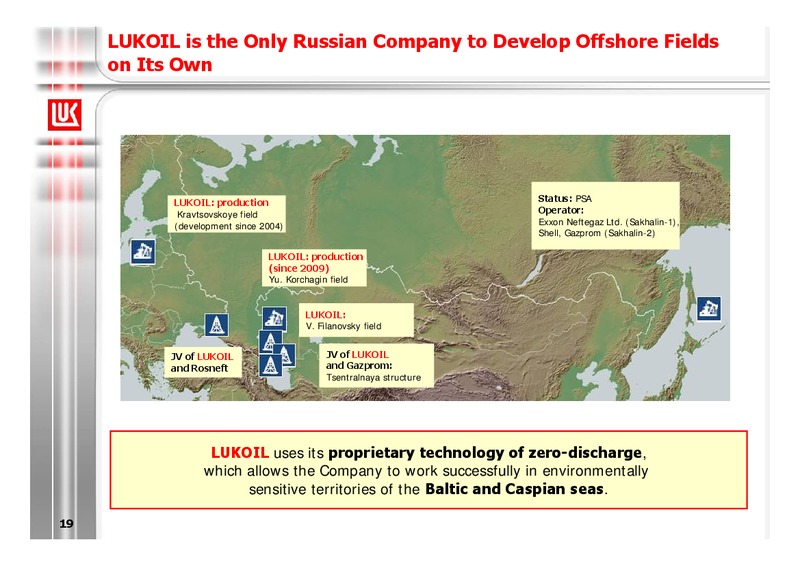
LUKOIL is the Only Russian Company to Develop Offshore Fields on Its Own LUKOIL: production Status: PSA Kravtsovskoye field Operator: (development since 2004) Exxon Neftegaz Ltd. (Sakhalin-1), Shell, Gazprom (Sakhalin-2)…
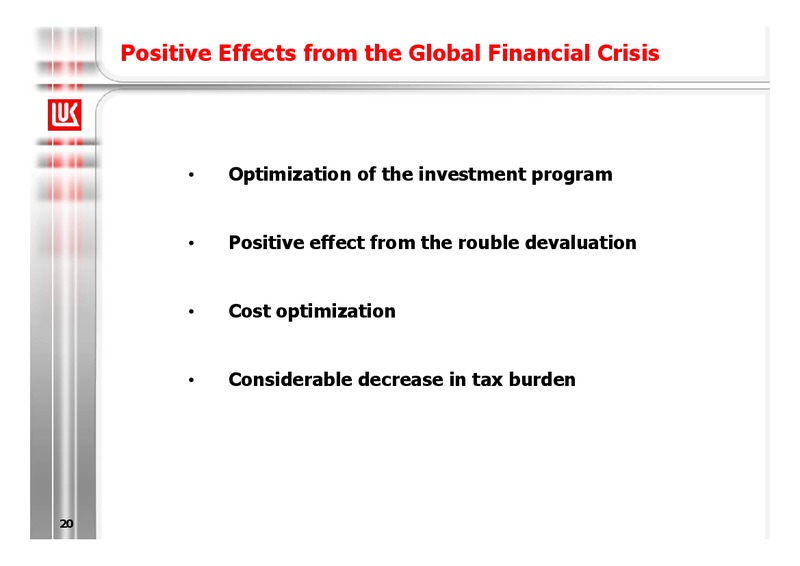
Positive Effects from the Global Financial Crisis Optimization of the investment program Positive effect from the rouble devaluation Cost optimization Considerable decrease in tax burden 20
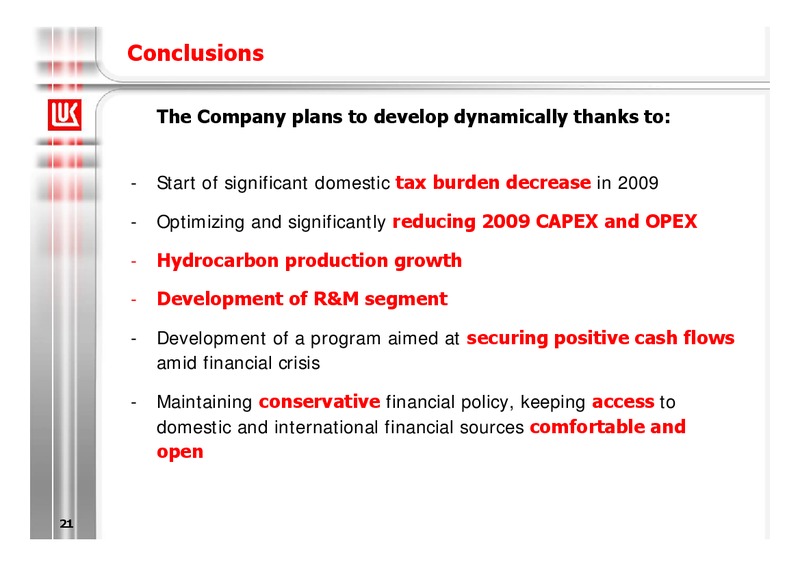
Conclusions The Company plans to develop dynamically thanks to: - Start of significant domestic tax burden decrease in 2009 - Optimizing and significantly reducing 2009 CAPEX and OPEX - Hydrocarbon production growth -…
 Loading...