1Q 2008 Financial Results (US GAAP) Leonid Fedun, Vice-President of LUKOIL June 2008
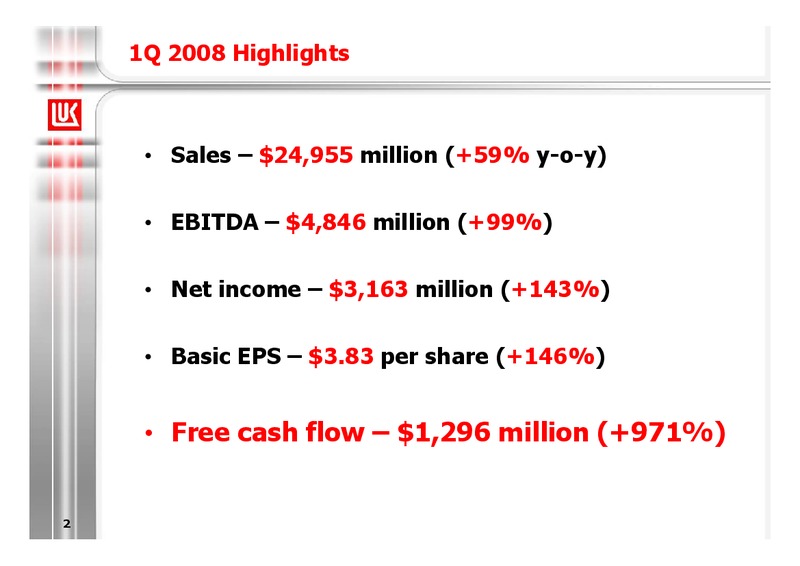
1Q 2008 Highlights Sales 24,955 million (+59% y-o-y) EBITDA 4,846 million (+99%) Net income 3,163 million (+143%) Basic EPS 3.83 per share (+146%) Free cash flow 1,296 million (+971%) 2
Macroeconomic and Tax Environment Positive factors 1Q 2008 to 1Q 2007 Negative factors Urals 71.6% R Natural gas (Russia) 25.0% E V Diesel fuel (Europe) 67.2% E N Fuel oil (Europe) 78.9% U E Diesel fuel (Russia) 58.8%…
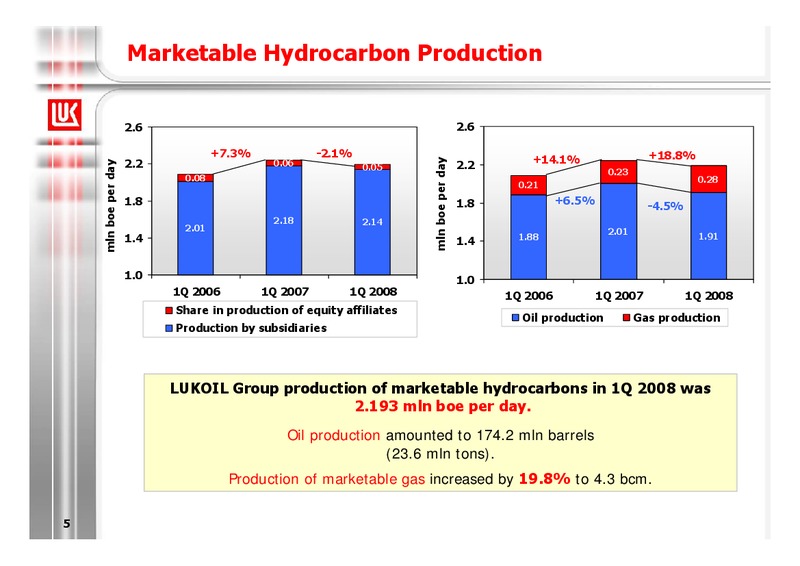
Main Operating Results 1Q 2008 to 1Q 2007 and (1Q 2008 actual level) Oil production -4.5% (1,915 th. barrels per day) Marketable gas +18.8% (278 th. production boe per day) Hydrocarbon -2.1% (2,193 th. boe per day)…
Marketable Hydrocarbon Production 2.6 2.6 +7.3% -2.1% +18.8% 2.2 +14.1% mln boe per day 0.06 2.2 mln boe per day 0.05 0.23 0.08 0.28 0.21 1.8 1.8 +6.5% -4.5% 2.18 2.14 2.01 2.01 1.4 1.88 1.91 1.4 1.0 1.0 1Q…
Crude Oil Refining Refinery throughputs reconciliation (y-o-y), Refining margin of Russian cracking th. barrels per day refinery, per barrel 1,100 25 1,073 28 20 1,050 19 15 38 1,000 988 10 950 2006 +8.6% 5 2007 +85 th.…
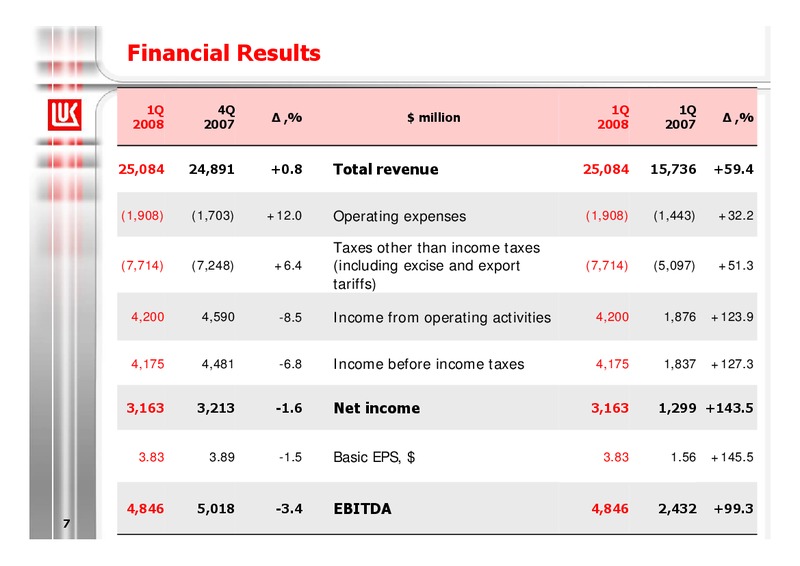
Financial Results 1Q 4Q 1Q 1Q ,% million ,% 2008 2007 2008 2007 25,084 24,891 +0.8 Total revenue 25,084 15,736 +59.4 (1,908) (1,703) +12.0 Operating expenses (1,908) (1,443) +32.2 Taxes other than income taxes (7,714)…
Sales Reconciliation 0.4 0.2 25.0 0.8 24 7.9 20 bln +59.4% 16 15.7 12 Total sales in 1Q Change in prices Change in volumes Increase in other Change in sales Total sales in 1Q 8 2007 sold sales mix 2008
Sales Breakdown, million 27,000 24,955 International sales of crude oil (excluding near-abroad countries) 24,000 Sales of crude oil in near-abroad 5,542 25% countries 21,000 +49.5% 325 Sales of crude oil in Russia 248 18,000…
OPEX Growth Drivers The substantial growth of operating expenses y-o-y was caused by the Lifting costs, /boe following factors: 5.0 - real ruble appreciation, which reached 17.3% y-o-y and affected all operating expense items 4.0…
Tax Burden Tax expenses of LUKOIL Group and crude oil price 9,000 130 Mineral extraction tax and export tariffs comparison, /ton 8,000 320 120 314 240 180 7,000 160 136 +74.4% 110 72 +88.4% 80 total tax expense, mln…
14 mln 0 2,000 4,000 6,000 8,000 Net income in 1Q 2007 1,299 Net increase in revenue* 5,690 Change in hedging 55 results Increase in equity share 45 in affiliates * Increase in revenue less…
15 mln 0 2,000 4,000 6,000 Cash at the beginning of the quarter 841 Operating activities 3,658 Net movements of 39 long-term debt Proceeds from sale of property and interests 28 in affiliates and…
CAPEX Breakdown 1Q 4Q 1Q 1Q ,% million ,% 2008 2007 2008 2007 1,981 2,004 -1.1 Exploration and production 1,981 1,716 +15.4 1,779 1,692 +5.1 Russia 1,779 1,565 +13.7 Including ConocoPhillips spending in 151 110 +37.3 151 123…
LUKOIL and Gazprom JV: First Major Success in Increasing Reserve Base JV TsentrCaspneftegaz (LUKOIL 50%, Gazprom 50%) discovered a major oil and gas condensate field at the Tsentralnaya structure (the Caspian Sea) on the border…
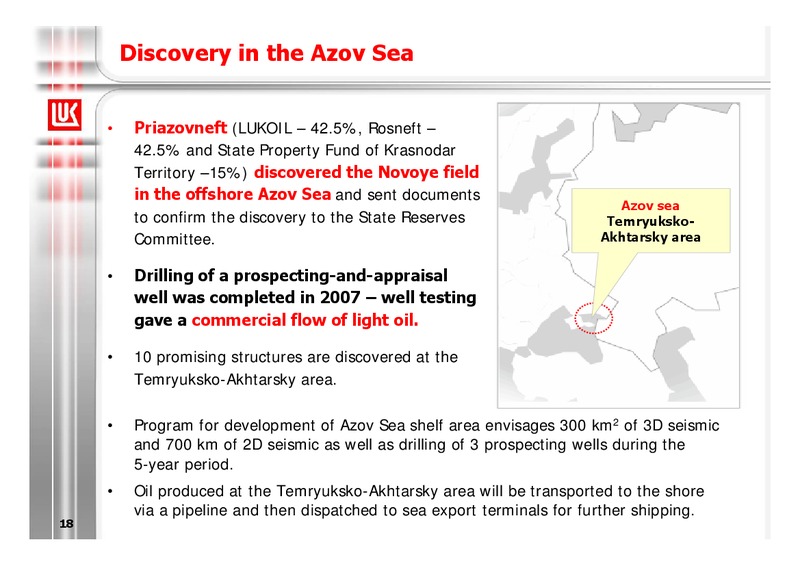
Discovery in the Azov Sea Priazovneft (LUKOIL 42.5%, Rosneft 42.5% and State Property Fund of Krasnodar Territory 15%) discovered the Novoye field in the offshore Azov Sea and sent documents Azov sea to confirm the discovery to…
Conclusions LUKOIL is going to develop dynamically exceeding market expectations thanks to: - Tax burden decrease - Accelerated refinery throughputs growth - Gas processing expanding - Cooperation with state companies - New…
 Loading...