2009 Financial Results (US GAAP) Leonid Fedun, Vice-President of LUKOIL March 2010
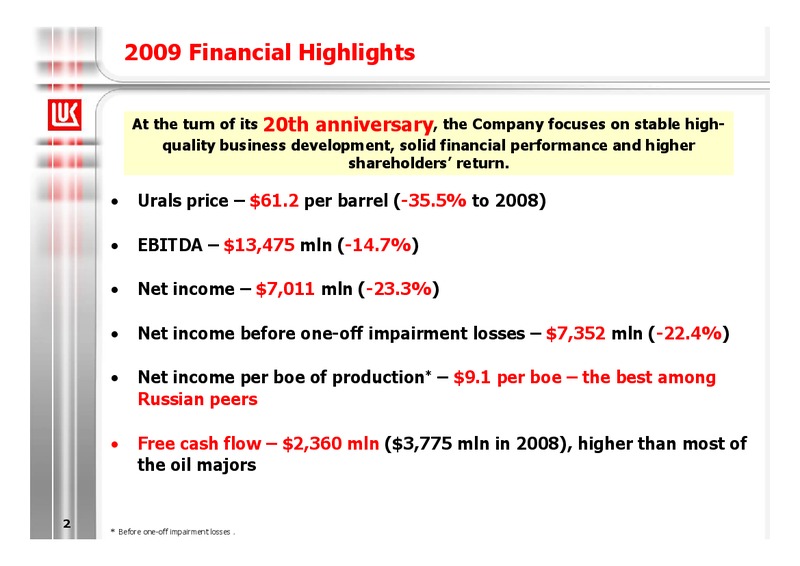
2009 Financial Highlights At the turn of its 20th anniversary, the Company focuses on stable high- quality business development, solid financial performance and higher shareholders return. Urals price 61.2 per barrel (-35.5% to…
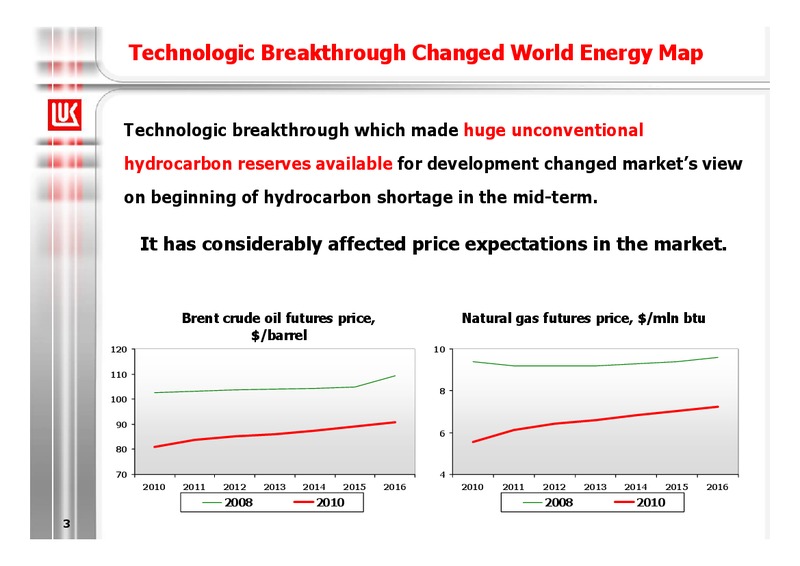
Technologic Breakthrough Changed World Energy Map Technologic breakthrough which made huge unconventional hydrocarbon reserves available for development changed markets view on beginning of hydrocarbon shortage in the mid-term. It…
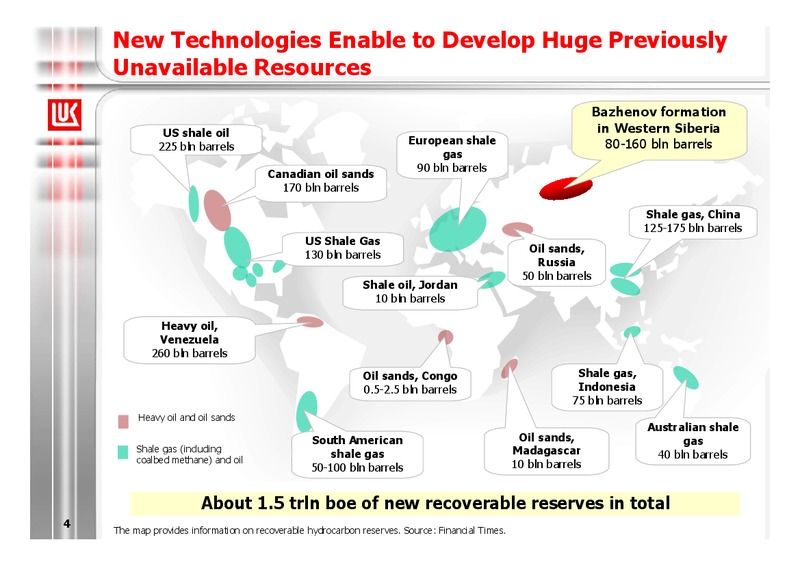
New Technologies Enable to Develop Huge Previously Unavailable Resources Bazhenov formation US shale oil in Western Siberia European shale 80-160 bln barrels 225 bln barrels gas 90 bln barrels Canadian oil sands 170 bln…
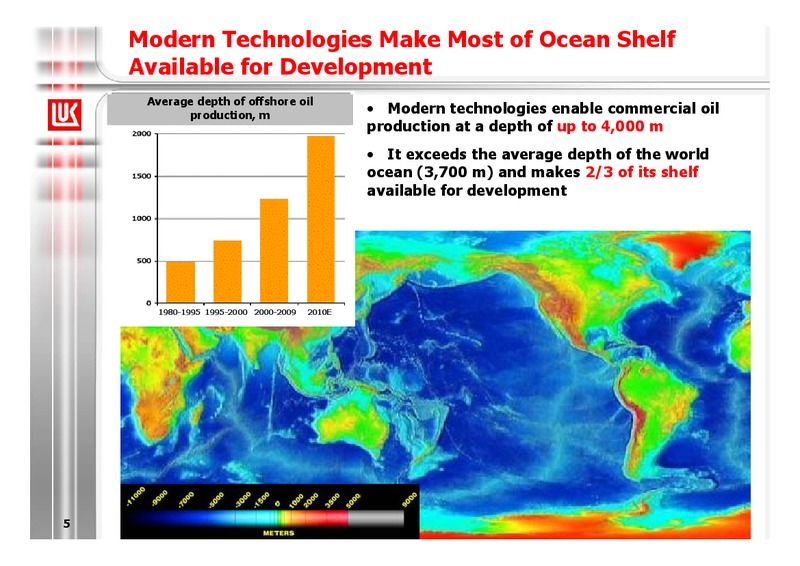
Modern Technologies Make Most of Ocean Shelf Available for Development Average depth of offshore oil production, m Modern technologies enable commercial oil production at a depth of up to 4,000 m It exceeds the average depth of the…
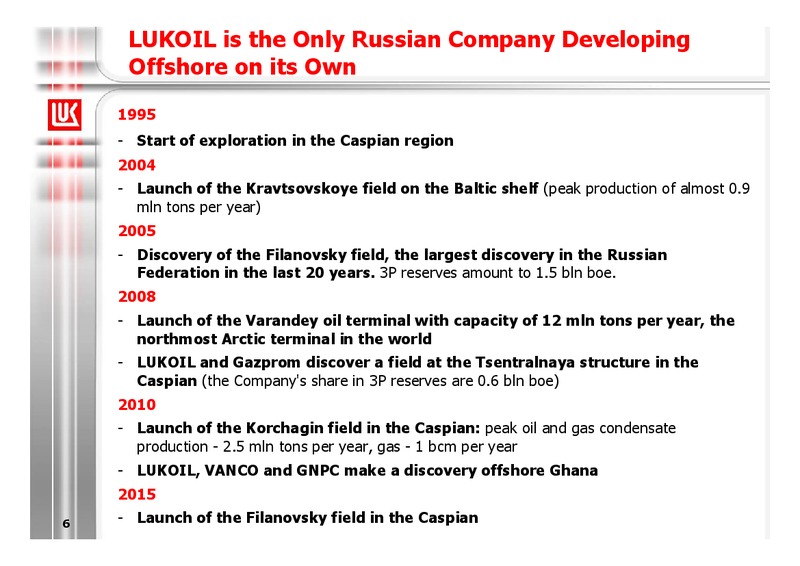
LUKOIL is the Only Russian Company Developing Offshore on its Own 1995 - Start of exploration in the Caspian region 2004 - Launch of the Kravtsovskoye field on the Baltic shelf (peak production of almost 0.9 mln tons per year)…
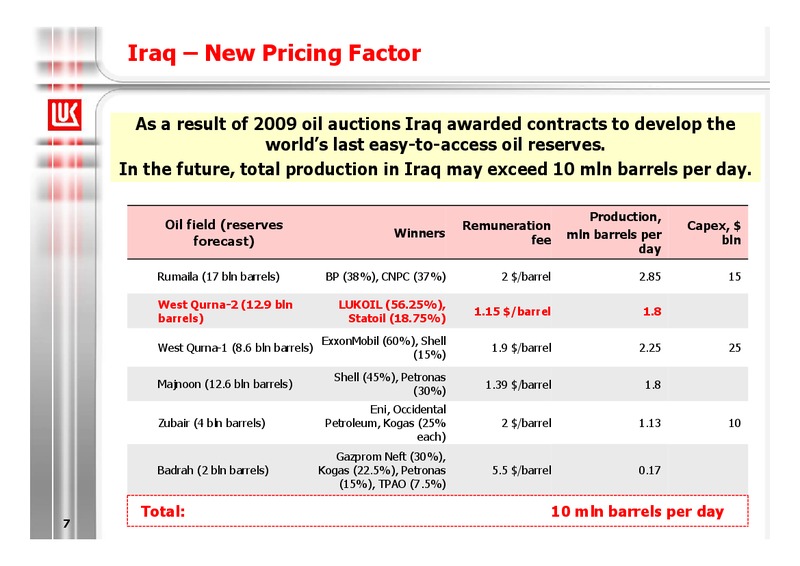
Iraq New Pricing Factor As a result of 2009 oil auctions Iraq awarded contracts to develop the worlds last easy-to-access oil reserves. In the future, total production in Iraq may exceed 10 mln barrels per day. Production, Oil…
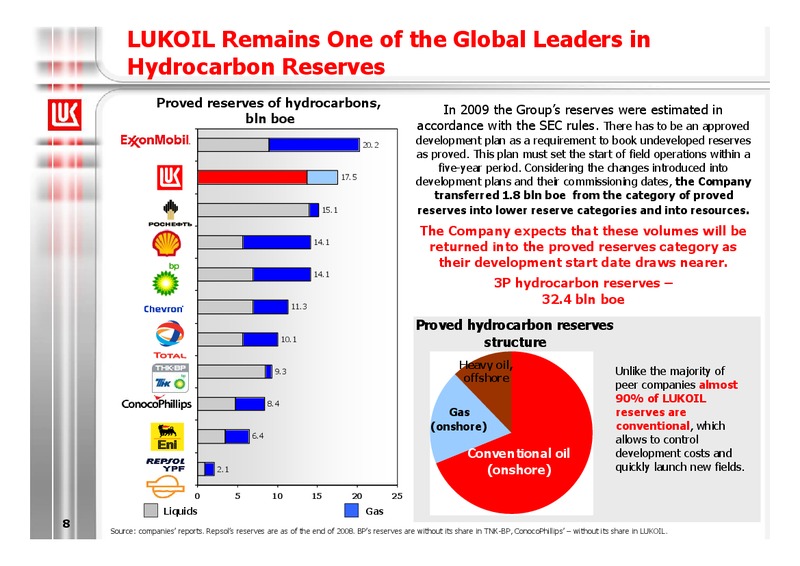
LUKOIL Remains One of the Global Leaders in Hydrocarbon Reserves Proved reserves of hydrocarbons, In 2009 the Groups reserves were estimated in bln boe accordance with the SEC rules. There has to be an approved ExxonMobil 20.2…
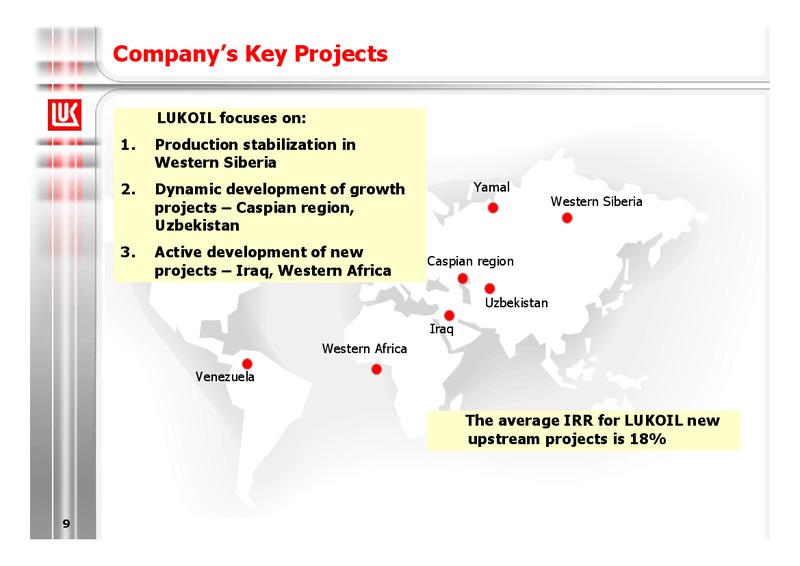
Companys Key Projects LUKOIL focuses on: 1. Production stabilization in Western Siberia 2. Dynamic development of growth Yamal projects Caspian region, Western Siberia Uzbekistan 3. Active development of new Caspian region…
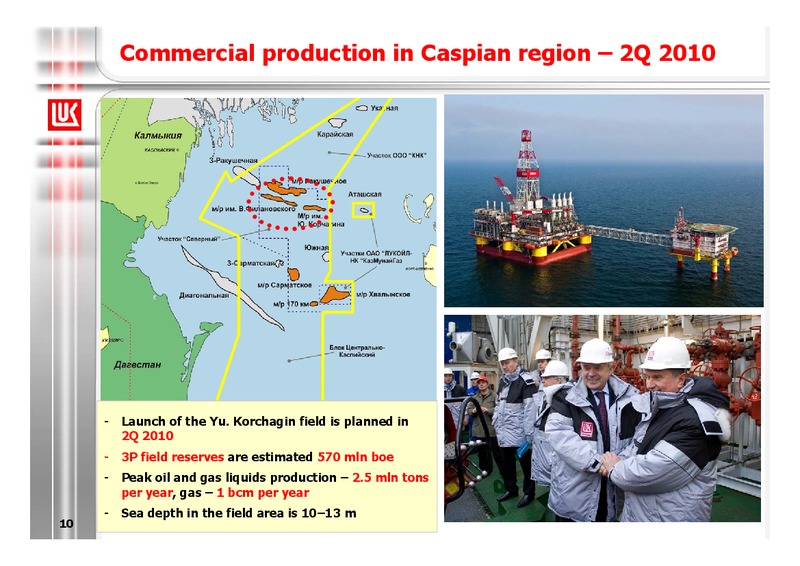
Commercial production in Caspian region 2Q 2010 - Launch of the Yu. Korchagin field is planned in 2Q 2010 - 3P field reserves are estimated 570 mln boe - Peak oil and gas liquids production 2.5 mln tons per year, gas 1 bcm per…
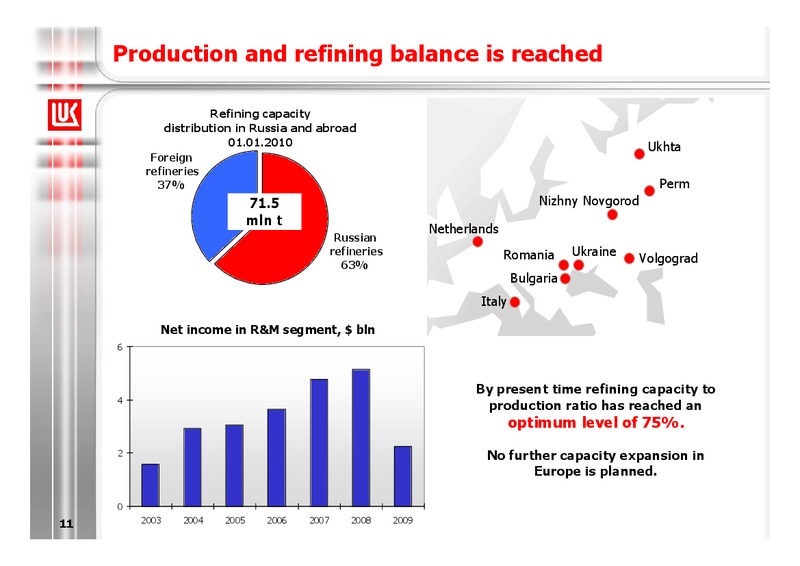
Production and refining balance is reached Refining capacity distribution in Russia and abroad 01.01.2010 Ukhta Foreign refineries 37% Perm 71.5 Nizhny Novgorod mln t Netherlands Russian refineries Romania Ukraine 63%…
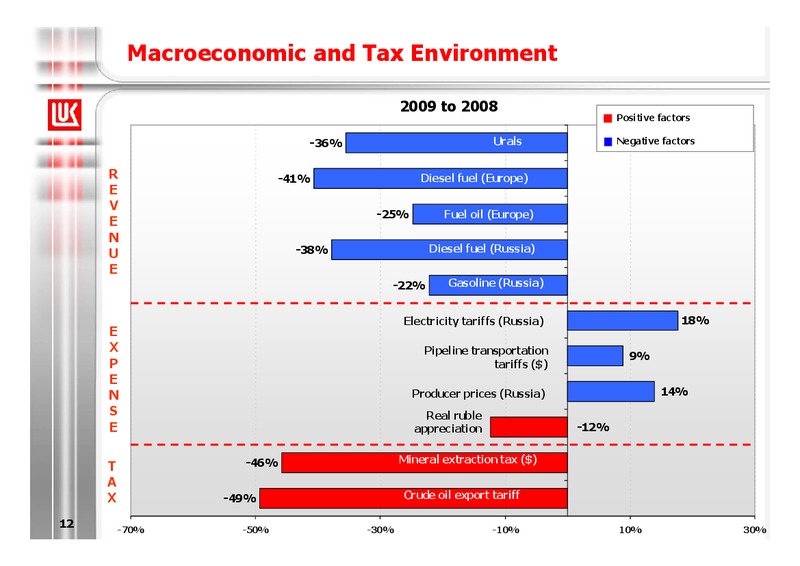
Macroeconomic and Tax Environment 2009 to 2008 Positive factors -36% Urals Negative factors R -41% Diesel fuel (Europe) E V -25% Fuel oil (Europe) E N U -38% Diesel fuel (Russia) E -22% Gasoline (Russia) Electricity…
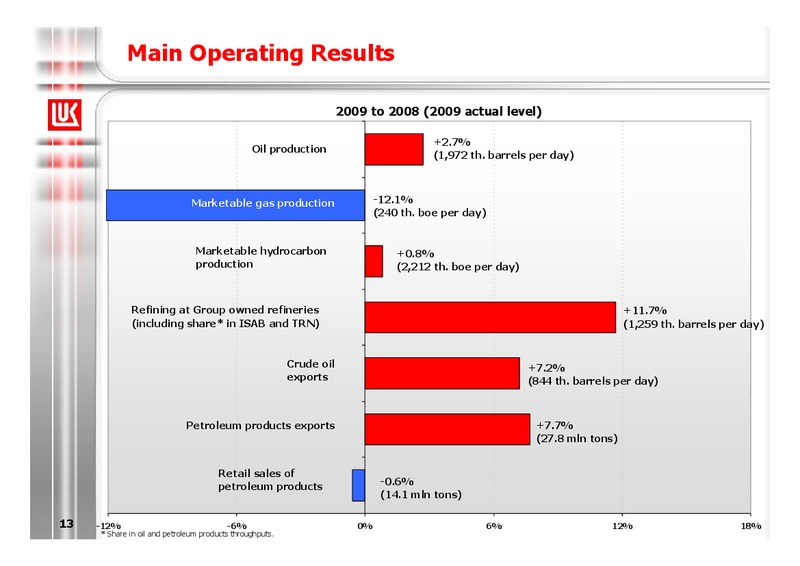
Main Operating Results 2009 to 2008 (2009 actual level) +2.7% Oil production (1,972 th. barrels per day) Marketable gas production -12.1% (240 th. boe per day) Marketable hydrocarbon +0.8% production (2,212 th. boe per…
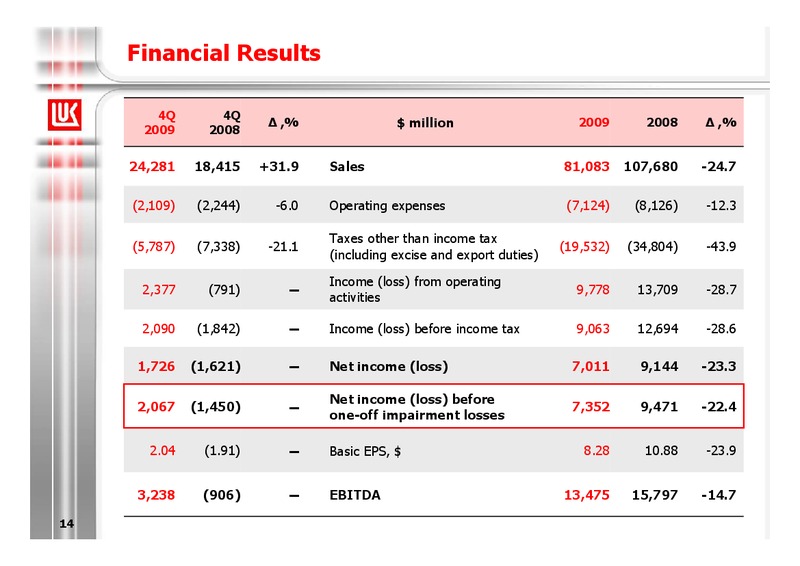
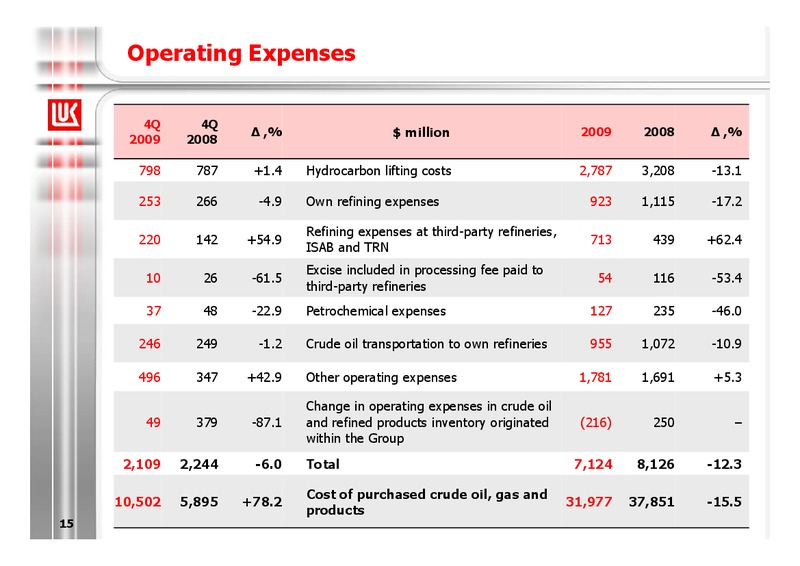
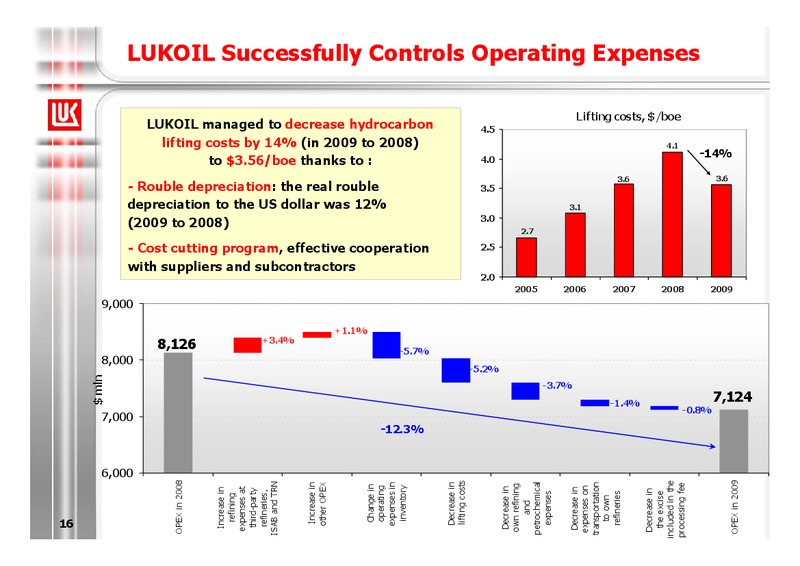
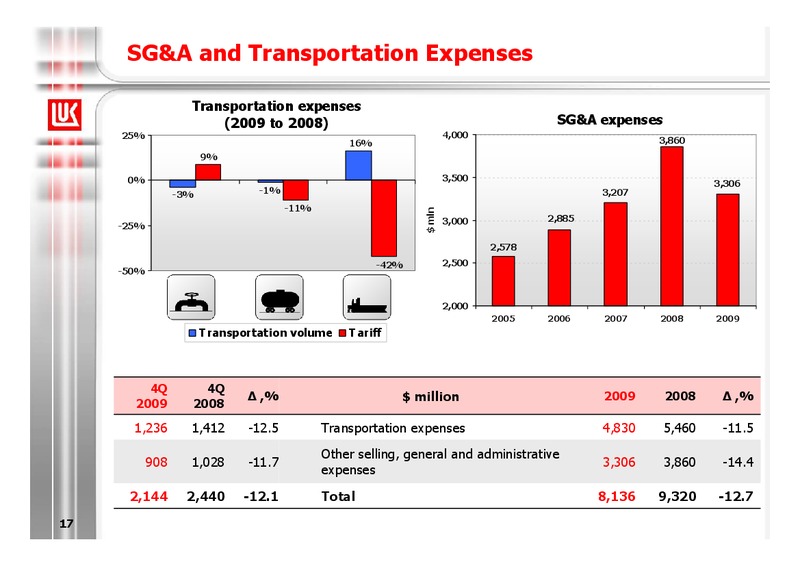
Financial Results 4Q 4Q ,% million 2009 2008 ,% 2009 2008 24,281 18,415 +31.9 Sales 81,083 107,680 -24.7 (2,109) (2,244) -6.0 Operating expenses (7,124) (8,126) -12.3 Taxes other than income tax (5,787) (7,338) -21.1 (19,532)…
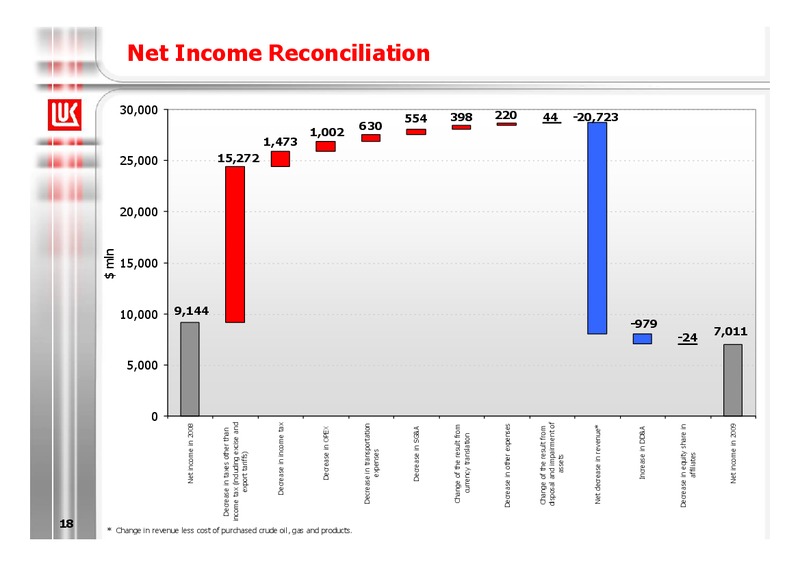
18 mln 0 5,000 10,000 15,000 20,000 25,000 30,000 Net income in 2008 9,144 Decrease in taxes other than income tax (including excise and export tariffs) 15,272 Decrease in income tax 1,473 Decrease in…
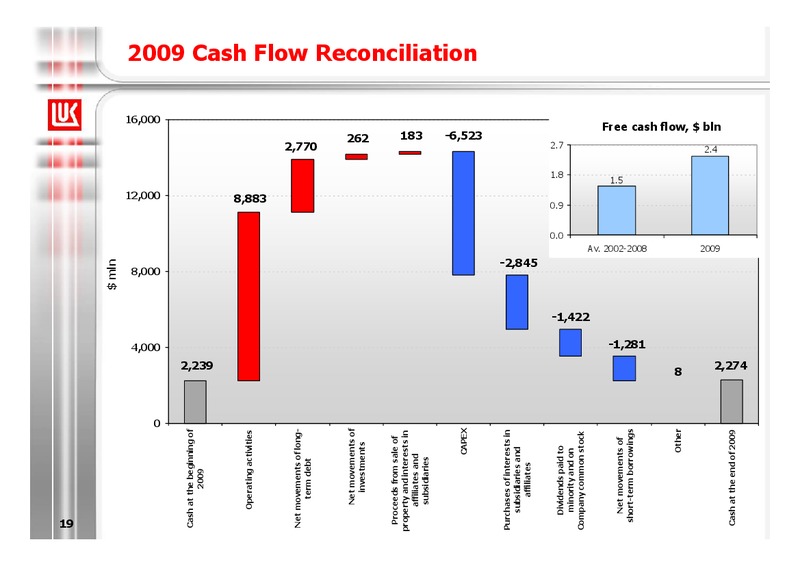
19 mln 0 4,000 8,000 12,000 16,000 Cash at the beginning of 2009 2,239 Operating activities 8,883 Net movements of long- term debt 2,770 Net movements of investments 262 Proceeds from sale of…
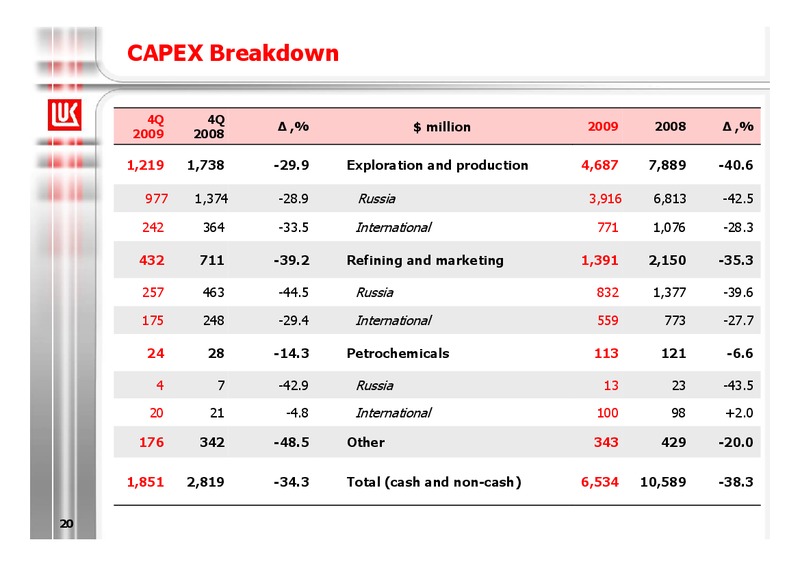
CAPEX Breakdown 4Q 4Q ,% million 2009 2008 ,% 2009 2008 1,219 1,738 -29.9 Exploration and production 4,687 7,889 -40.6 977 1,374 -28.9 Russia 3,916 6,813 -42.5 242 364 -33.5 International 771 1,076 -28.3 432 711 -39.2…
Conclusion To maintain the proper balance between the growth rate of the Company business and high financial efficiency Highly profitable E&P projects development Good financial position, high cash flows Increase in…
 Loading...