2008 Financial Results (US GAAP) Leonid Fedun, Vice-President of LUKOIL April 2009
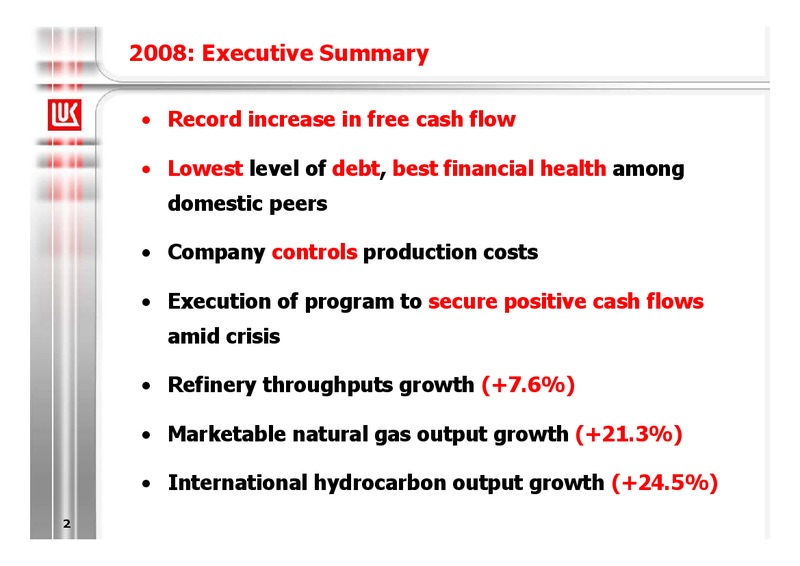
2008: Executive Summary Record increase in free cash flow Lowest level of debt, best financial health among domestic peers Company controls production costs Execution of program to secure positive cash flows amid crisis…
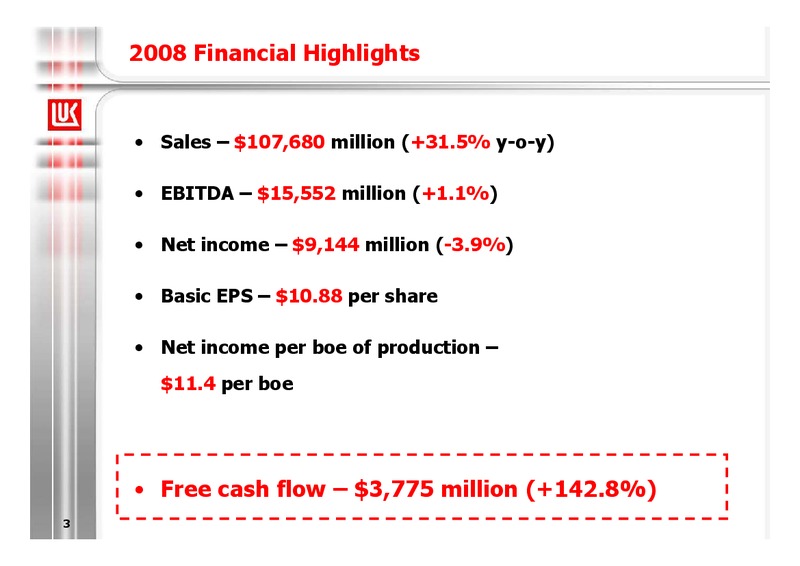
2008 Financial Highlights Sales 107,680 million (+31.5% y-o-y) EBITDA 15,552 million (+1.1%) Net income 9,144 million (-3.9%) Basic EPS 10.88 per share Net income per boe of production 11.4 per boe Free cash flow 3,775…
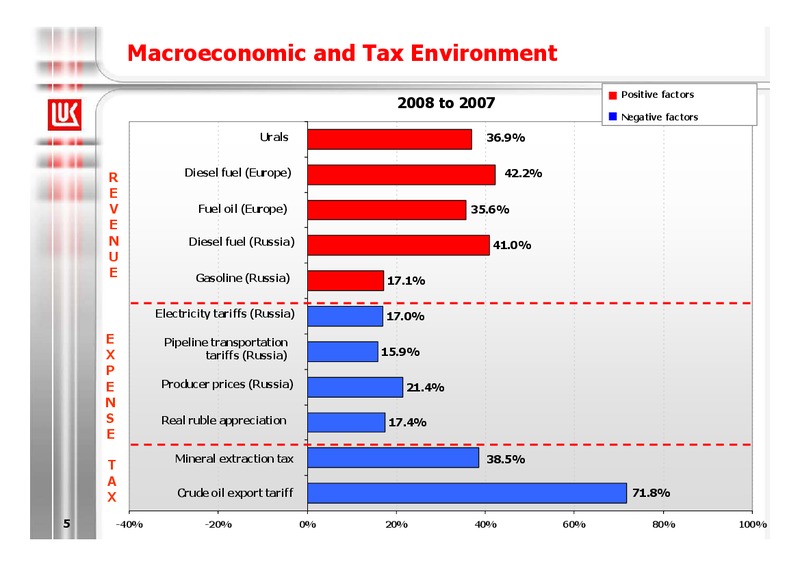
Macroeconomic and Tax Environment Positive factors 2008 to 2007 Negative factors Urals 36.9% R Diesel fuel (Europe) 42.2% E V Fuel oil (Europe) 35.6% E N Diesel fuel (Russia) 41.0% U E Gasoline (Russia) 17.1% Electricity…
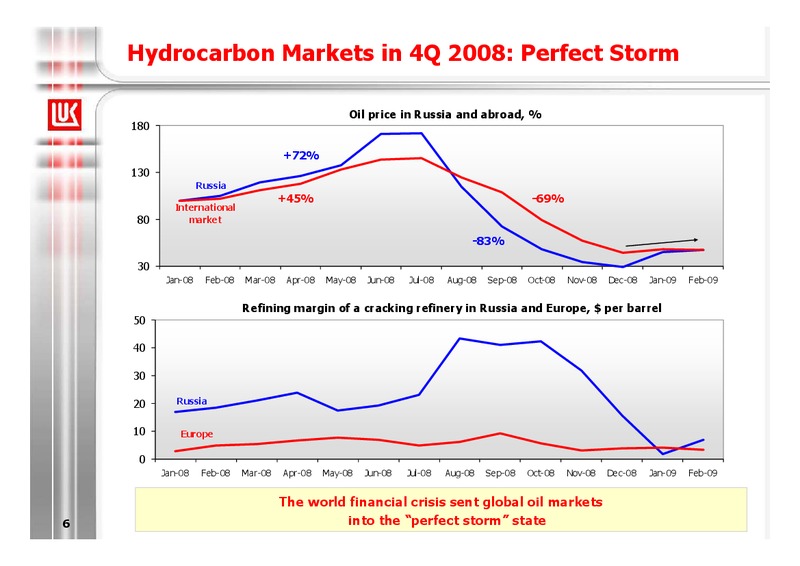
Hydrocarbon Markets in 4Q 2008: Perfect Storm Oil price in Russia and abroad, % 180 +72% 130 Russia +45% -69% International 80 market -83% 30 Jan-08 Feb-08 Mar-08 Apr-08 May-08 Jun-08 Jul-08 Aug-08 Sep-08 Oct-08 Nov-08…
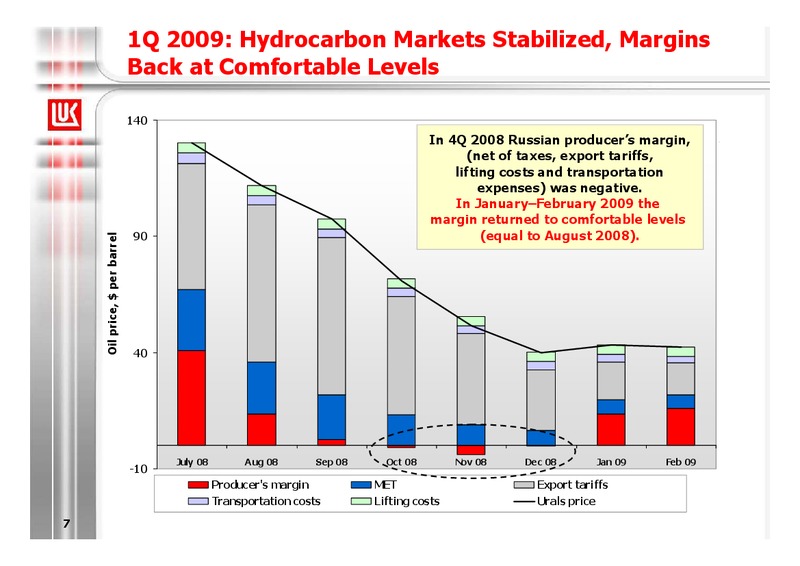
1Q 2009: Hydrocarbon Markets Stabilized, Margins Back at Comfortable Levels 140 In 4Q 2008 Russian producers margin, (net of taxes, export tariffs, lifting costs and transportation expenses) was negative. In JanuaryFebruary 2009…
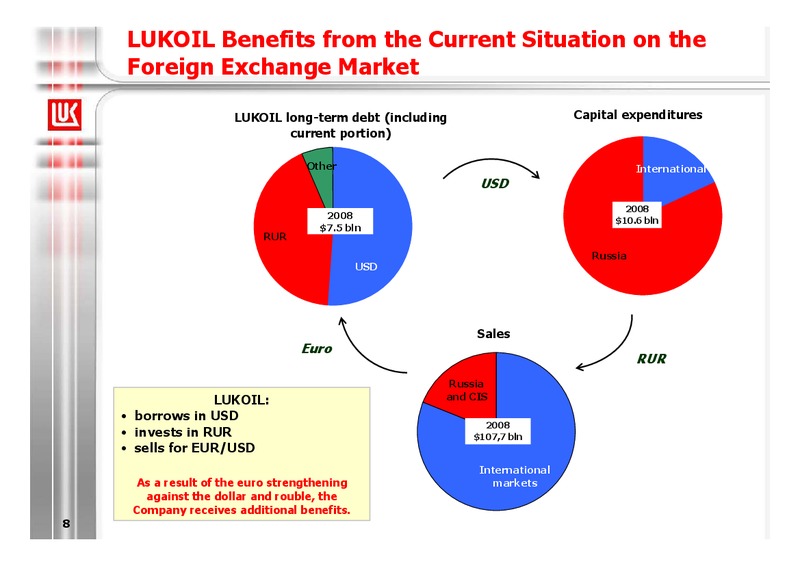
LUKOIL Benefits from the Current Situation on the Foreign Exchange Market LUKOIL long-term debt (including Capital expenditures current portion) Other International USD 2008 2008 10.6 bln 7.5 bln RUR Russia USD Sales…
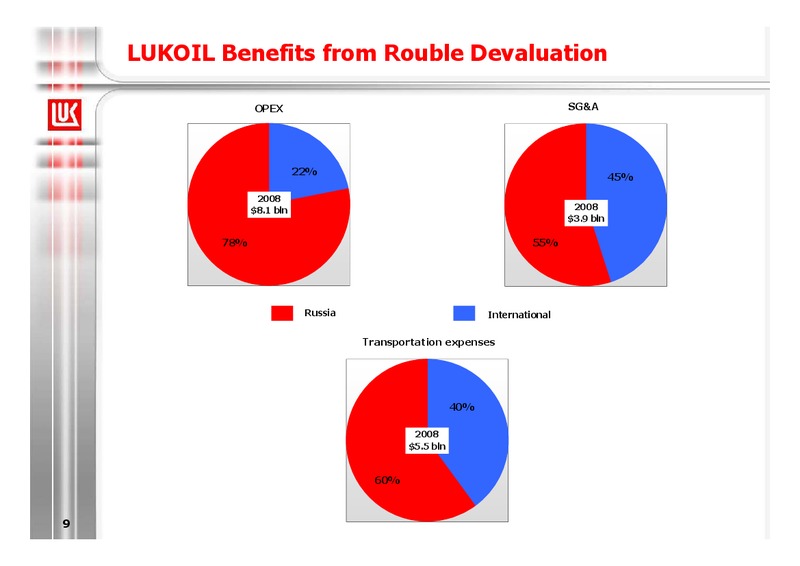
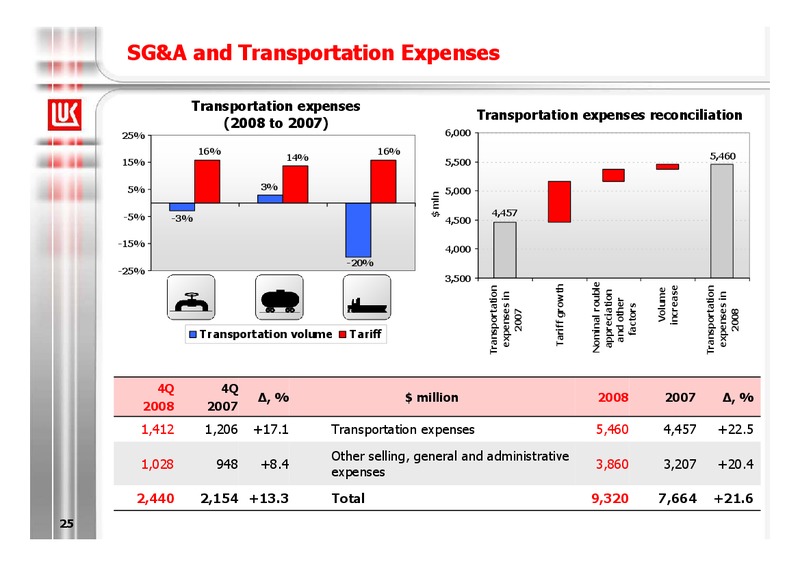
LUKOIL Benefits from Rouble Devaluation OPEX SG&A 22% 45% 2008 8.1 bln 2008 3.9 bln 78% 55% Russia International Transportation expenses 40% 2008 5.5 bln 60% 9
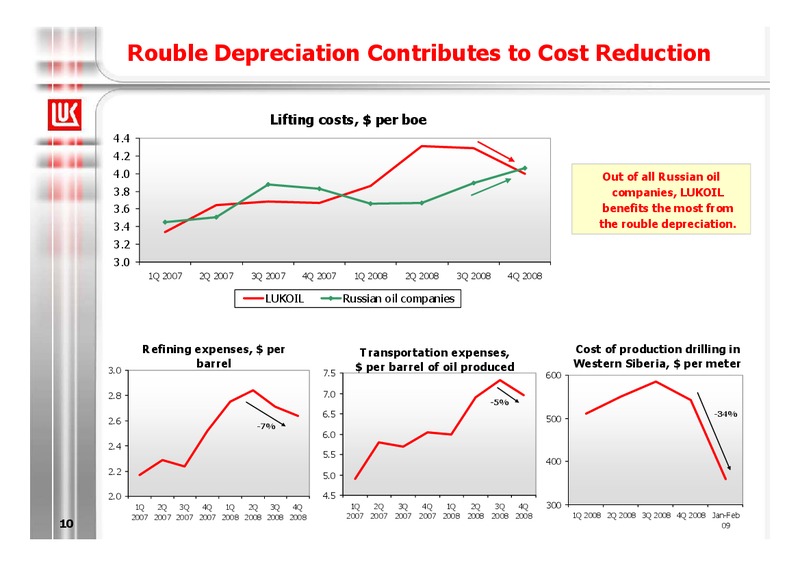
Rouble Depreciation Contributes to Cost Reduction Lifting costs, per boe 4.4 4.2 4.0 Out of all Russian oil 3.8 companies, LUKOIL 3.6 benefits the most from 3.4 the rouble depreciation. 3.2 3.0 1Q 2007 2Q 2007 3Q 2007 4Q 2007…
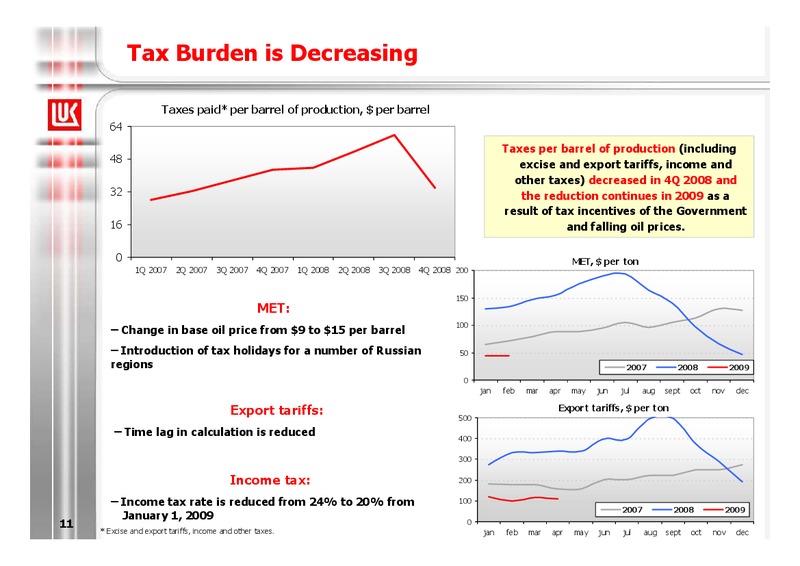
Tax Burden is Decreasing Taxes paid* per barrel of production, per barrel 64 Taxes per barrel of production (including 48 excise and export tariffs, income and other taxes) decreased in 4Q 2008 and 32 the reduction continues in…
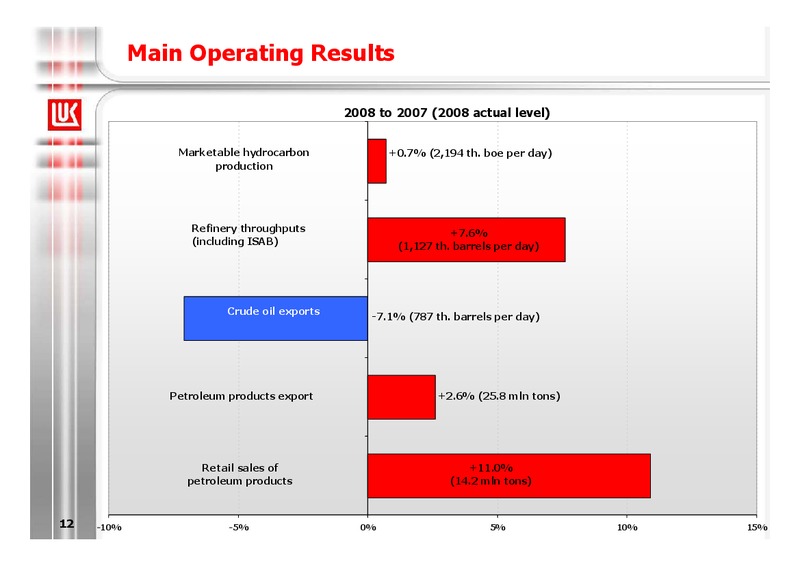
Main Operating Results 2008 to 2007 (2008 actual level) Marketable hydrocarbon +0.7% (2,194 th. boe per day) production Refinery throughputs +7.6% (including ISAB) (1,127 th. barrels per day) Crude oil exports -7.1% (787…
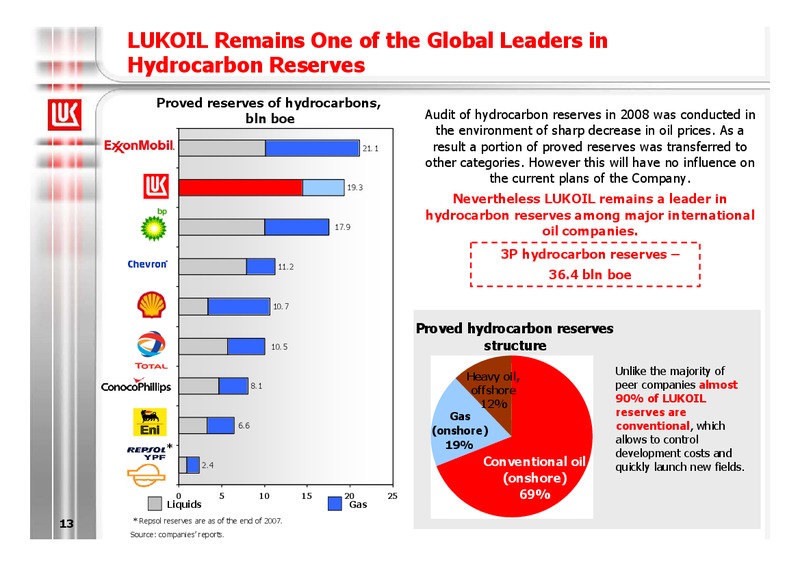
LUKOIL Remains One of the Global Leaders in Hydrocarbon Reserves Proved reserves of hydrocarbons, bln boe Audit of hydrocarbon reserves in 2008 was conducted in the environment of sharp decrease in oil prices. As a Exxon 21.1 result…
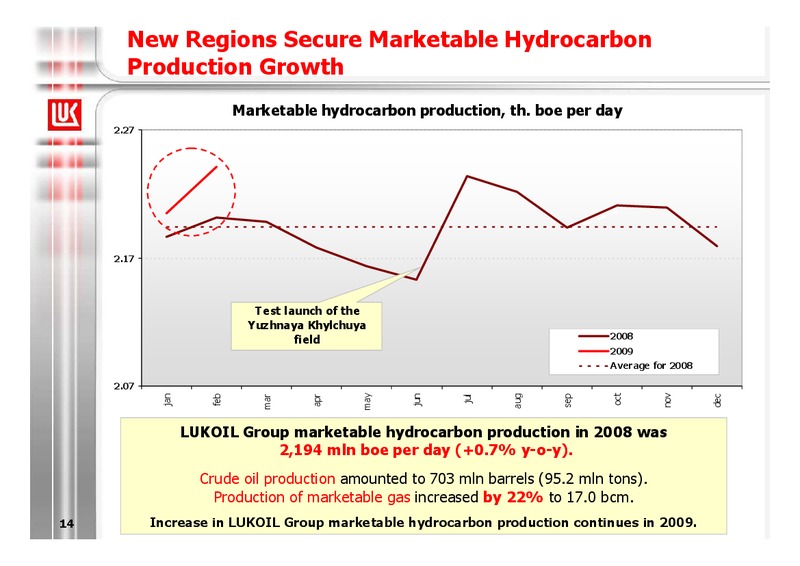
New Regions Secure Marketable Hydrocarbon Production Growth Marketable hydrocarbon production, th. boe per day 2.27 2.17 Test launch of the Yuzhnaya Khylchuya field 2008 2009 Average for 2008 2.07 may nov oct…
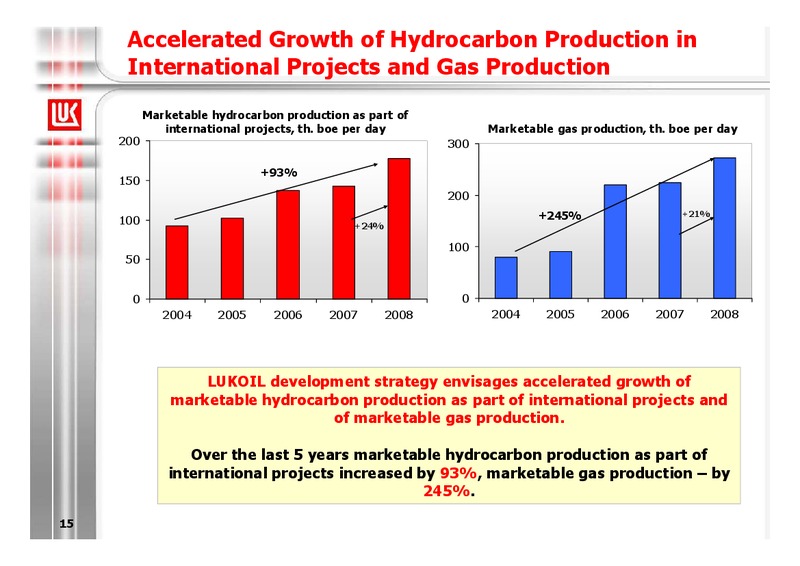
Accelerated Growth of Hydrocarbon Production in International Projects and Gas Production Marketable hydrocarbon production as part of international projects, th. boe per day Marketable gas production, th. boe per day 200 300 +93%…
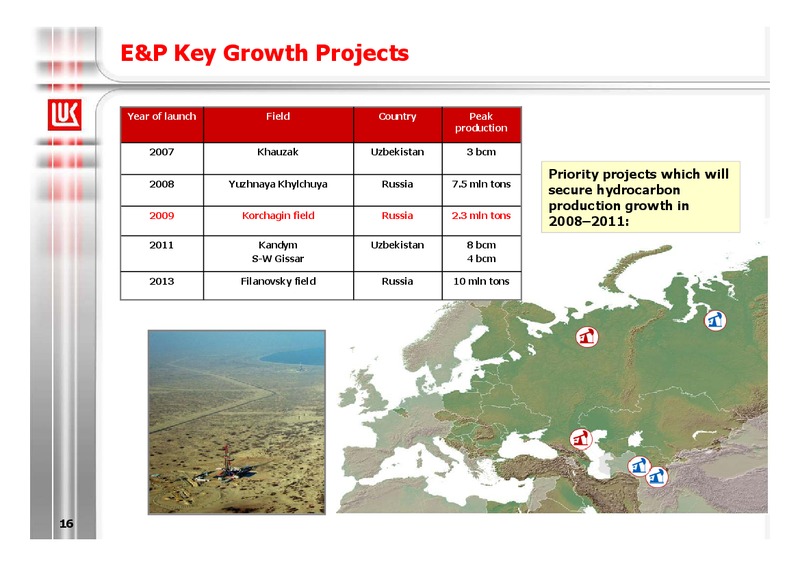
E&P Key Growth Projects Year of launch Field Country Peak production 2007 Khauzak Uzbekistan 3 bcm Priority projects which will 2008 Yuzhnaya Khylchuya Russia 7.5 mln tons secure hydrocarbon production growth in 2009…
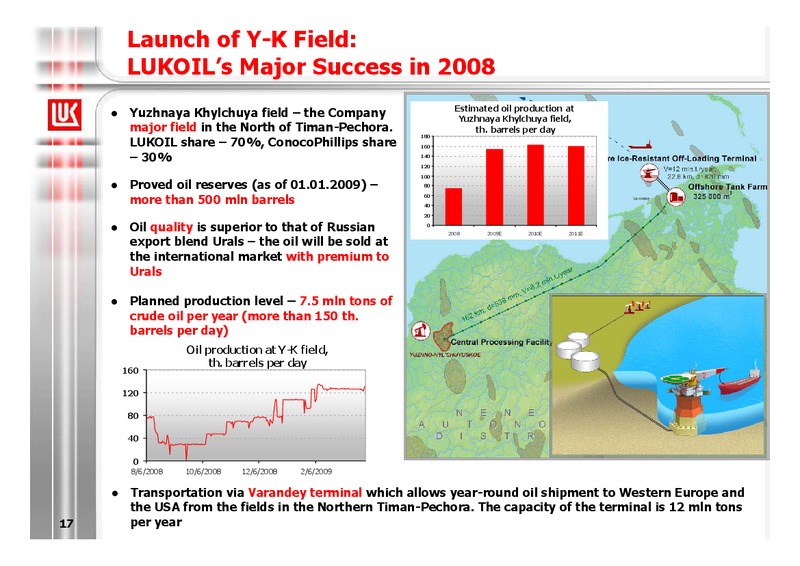
Launch of Y-K Field: LUKOILs Major Success in 2008 Estimated oil production at Yuzhnaya Khylchuya field the Company Yuzhnaya Khylchuya field, major field in the North of Timan-Pechora. th. barrels per day 180 LUKOIL share 70%,…
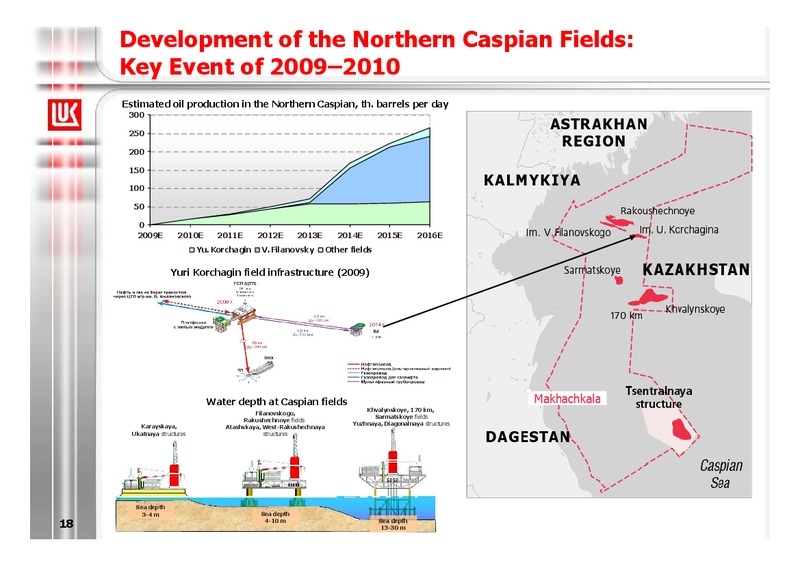
Development of the Northern Caspian Fields: Key Event of 20092010 Estimated oil production in the Northern Caspian, th. barrels per day 300 250 200 150 100 50 0 2009E 2010E 2011E 2012E 2013E 2014E 2015E 2016E Yu.…
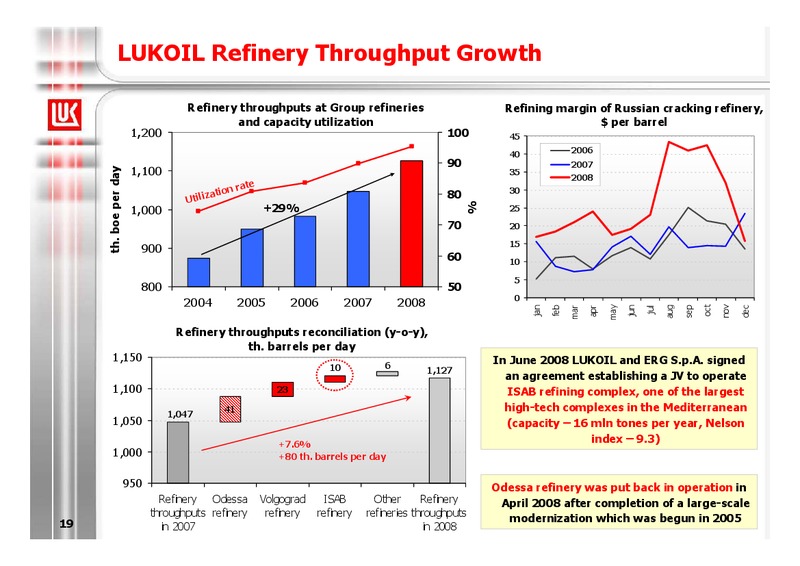
LUKOIL Refinery Throughput Growth Refinery throughputs at Group refineries Refining margin of Russian cracking refinery, and capacity utilization per barrel 1,200 100 45 40 2006 90 2007 1,100 th. boe per day 35 2008 rate…
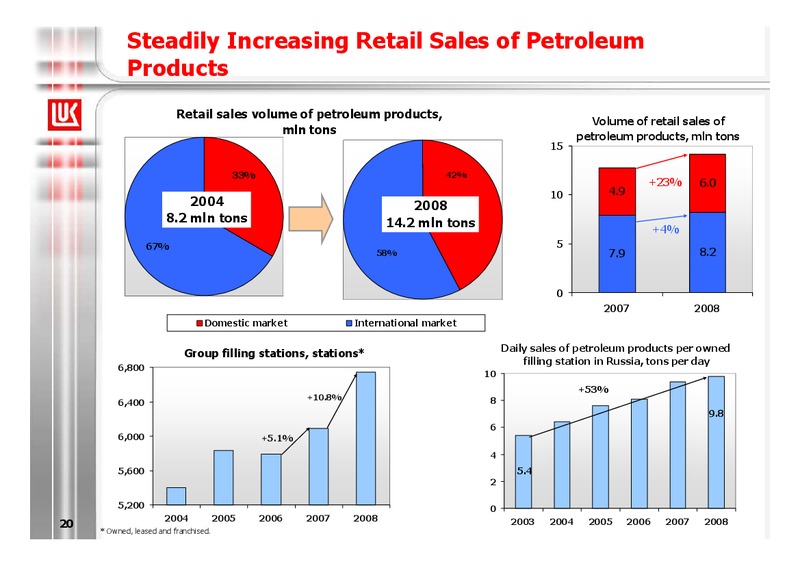
Steadily Increasing Retail Sales of Petroleum Products Retail sales volume of petroleum products, Volume of retail sales of mln tons petroleum products, mln tons 15 33% 42% +23% 6.0 10 4.9 2004 2008 8.2 mln tons 14.2 mln…
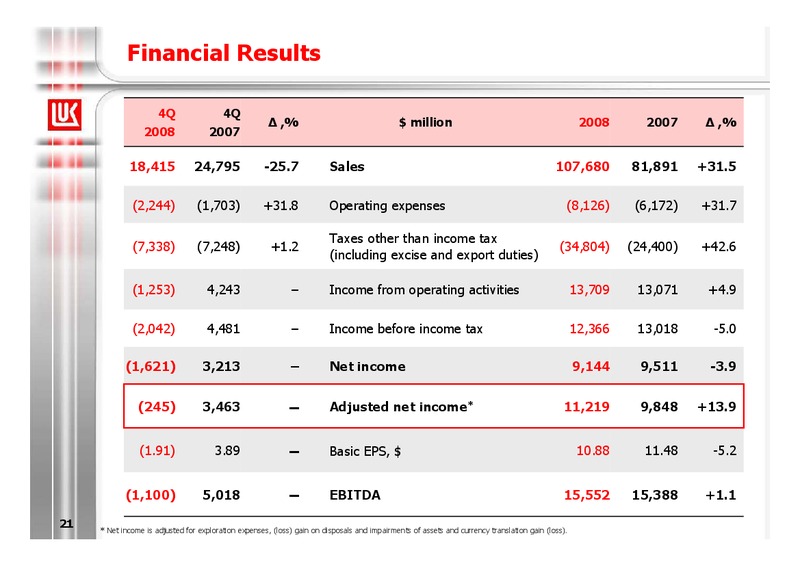
Financial Results 4Q 4Q ,% million 2008 2007 ,% 2008 2007 18,415 24,795 -25.7 Sales 107,680 81,891 +31.5 (2,244) (1,703) +31.8 Operating expenses (8,126) (6,172) +31.7 Taxes other than income tax (7,338) (7,248) +1.2 (34,804)…
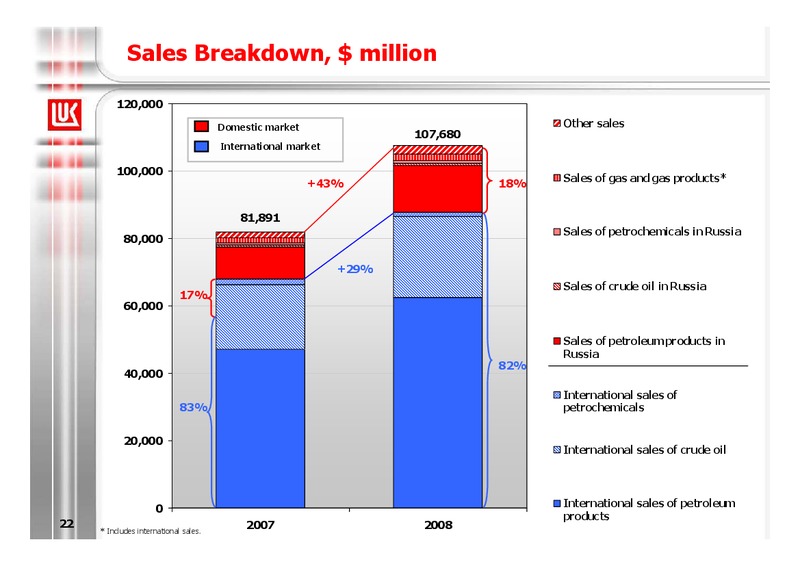
Sales Breakdown, million 120,000 Domestic market Other sales 107,680 International market 100,000 Sales of gas and gas products* +43% 18% 81,891 Sales of petrochemicals in Russia 80,000 +29% Sales of crude oil in Russia…
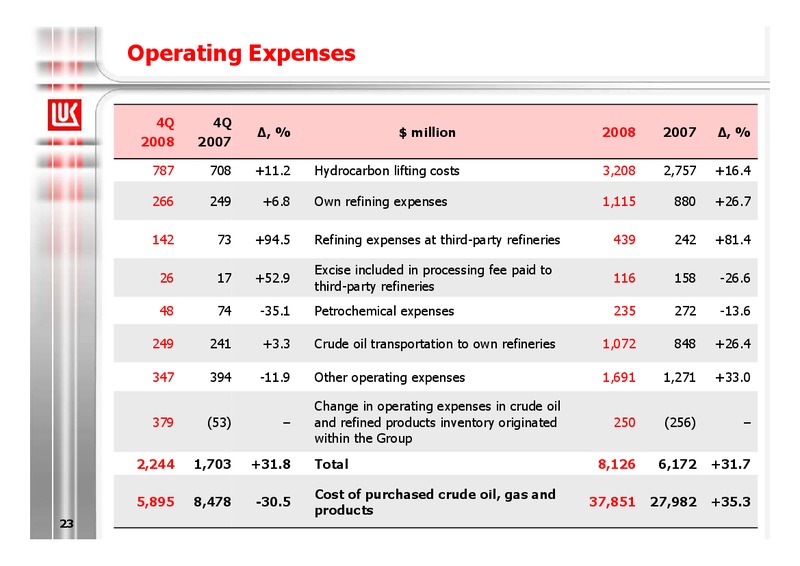
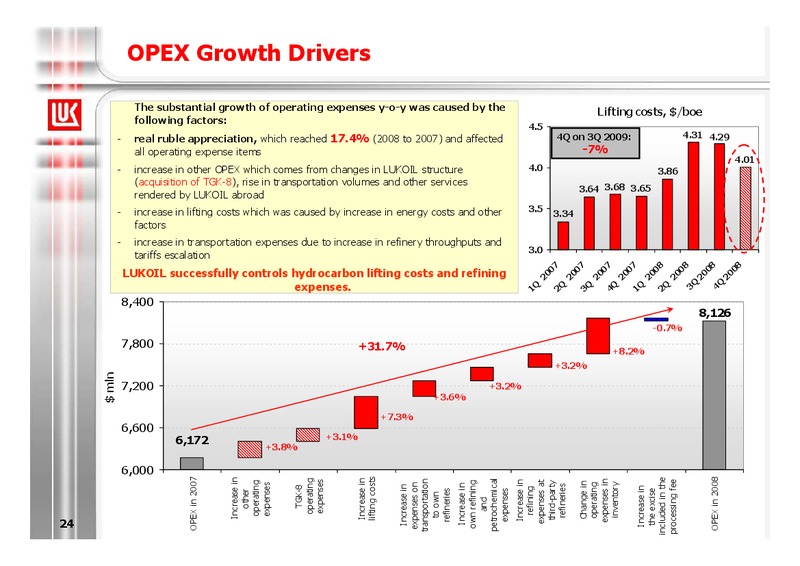
OPEX Growth Drivers The substantial growth of operating expenses y-o-y was caused by the Lifting costs, /boe following factors: 4.5 - real ruble appreciation, which reached 17.4% (2008 to 2007) and affected 4Q on 3Q 2009: 4.31 4.29…
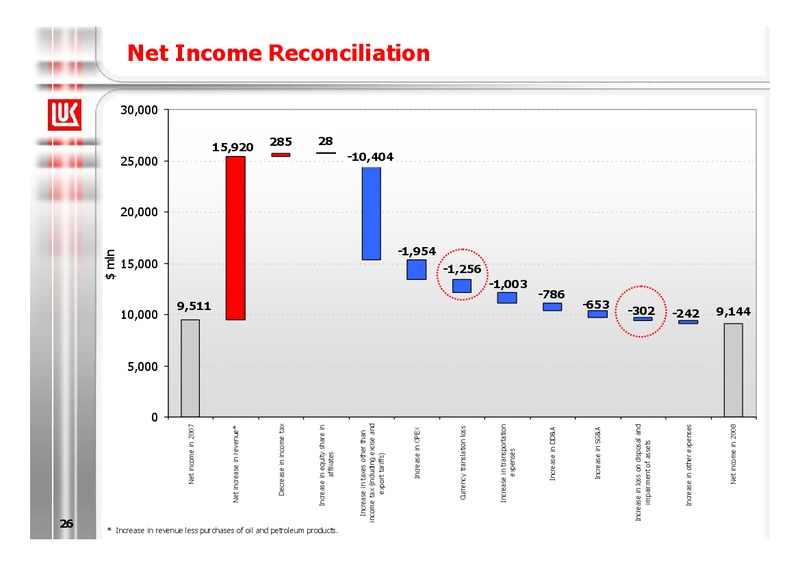
26 mln 0 5,000 10,000 15,000 20,000 25,000 30,000 Net income in 2007 9,511 Net increase in revenue* 15,920 Decrease in income tax 285 Increase in equity share in 28 affiliates * Increase in…
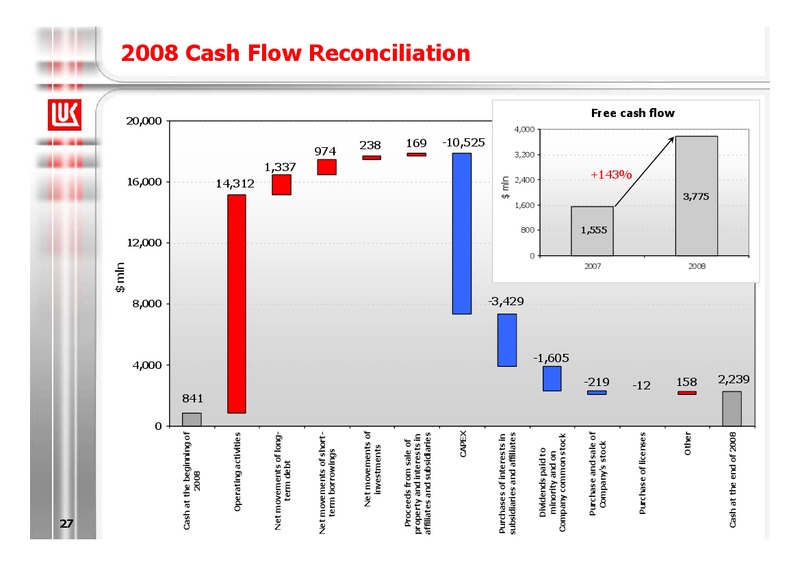
27 mln 0 4,000 8,000 12,000 16,000 20,000 Cash at the beginning of 2008 841 Operating activities 14,312 Net movements of long- term debt 1,337 Net movements of short- 974 term borrowings Net…
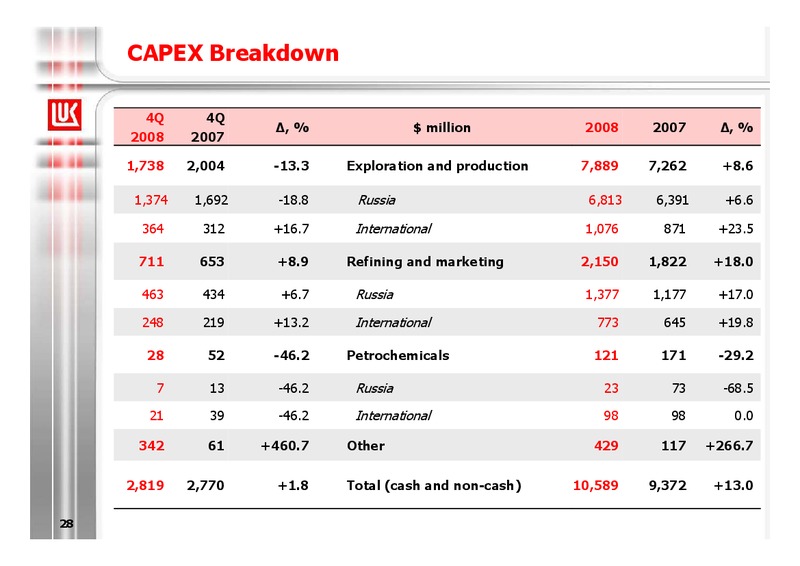
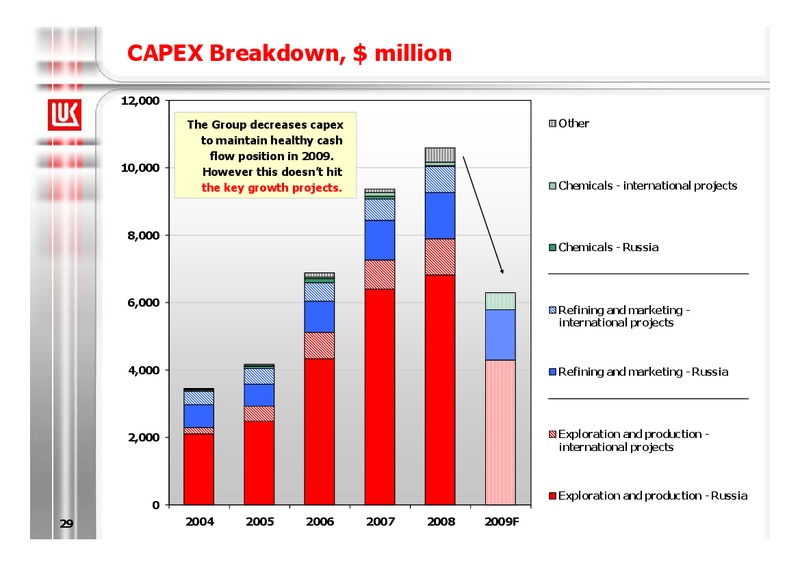
CAPEX Breakdown 4Q 4Q , % million 2008 2007 , % 2008 2007 1,738 2,004 -13.3 Exploration and production 7,889 7,262 +8.6 1,374 1,692 -18.8 Russia 6,813 6,391 +6.6 364 312 +16.7 International 1,076 871 +23.5 711 653 +8.9…
CAPEX Breakdown, million 12,000 The Group decreases capex Other to maintain healthy cash flow position in 2009. 10,000 However this doesnt hit the key growth projects. Chemicals - international projects 8,000 Chemicals -…
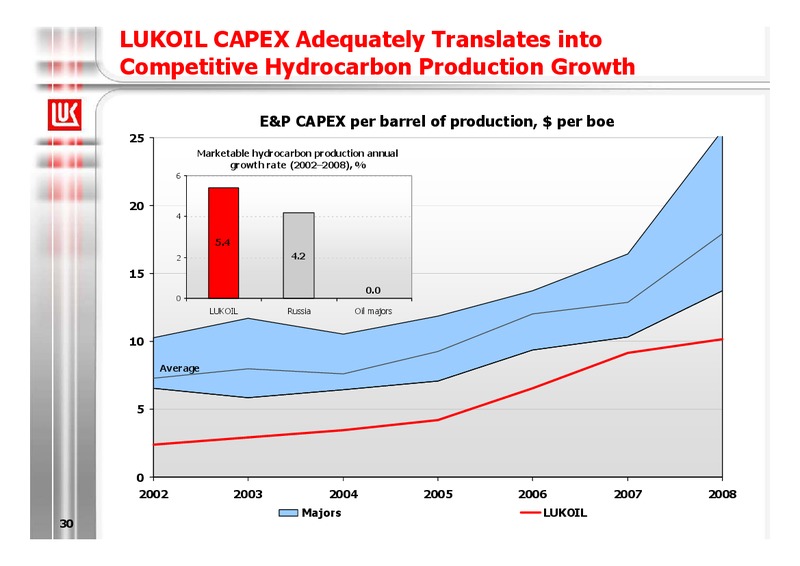
LUKOIL CAPEX Adequately Translates into Competitive Hydrocarbon Production Growth E&P CAPEX per barrel of production, per boe 25 Marketable hydrocarbon production annual growth rate (20022008), % 6 20 4 5.4 2 4.2 15…
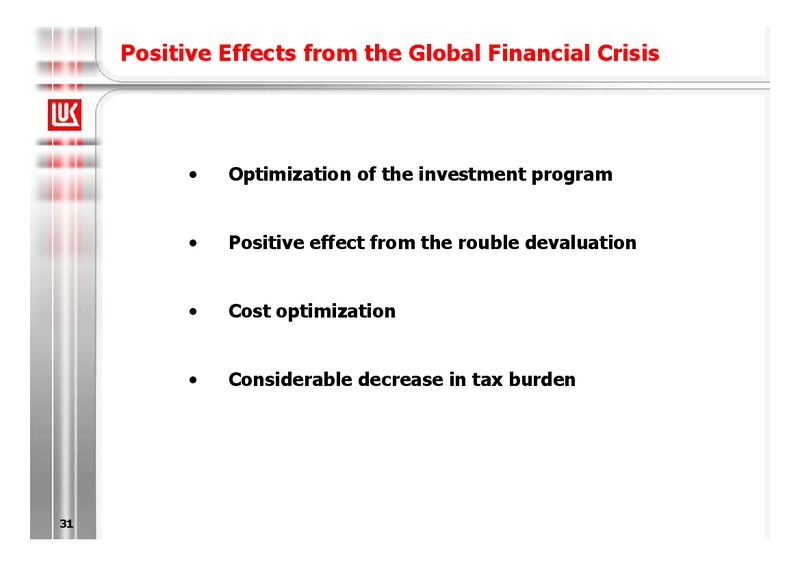
Positive Effects from the Global Financial Crisis Optimization of the investment program Positive effect from the rouble devaluation Cost optimization Considerable decrease in tax burden 31
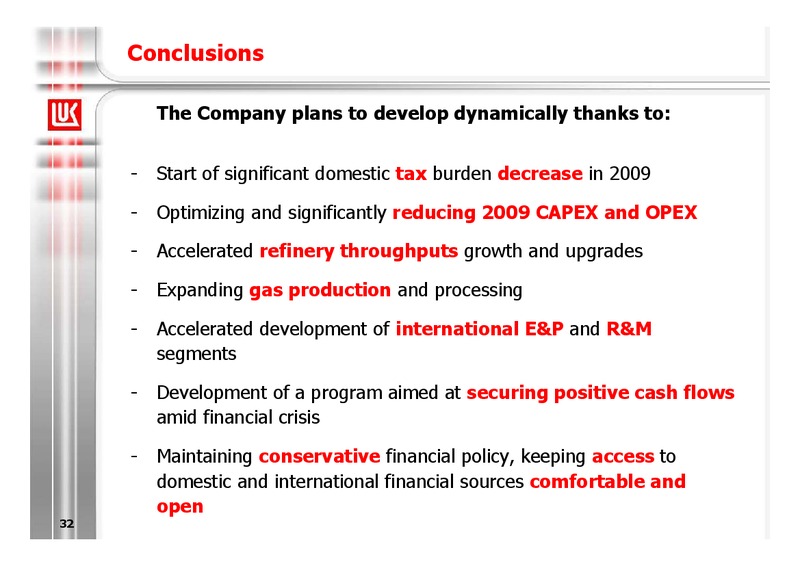
Conclusions The Company plans to develop dynamically thanks to: - Start of significant domestic tax burden decrease in 2009 - Optimizing and significantly reducing 2009 CAPEX and OPEX - Accelerated refinery throughputs growth…
 Loading...