2Q 2014 Financial Results (US GAAP) Member of BoD Member of Management Board Vice-President for Strategic Development Senior Vice-President for Finance Leonid Fedun Alexander Matytsyn Moscow, August 2014
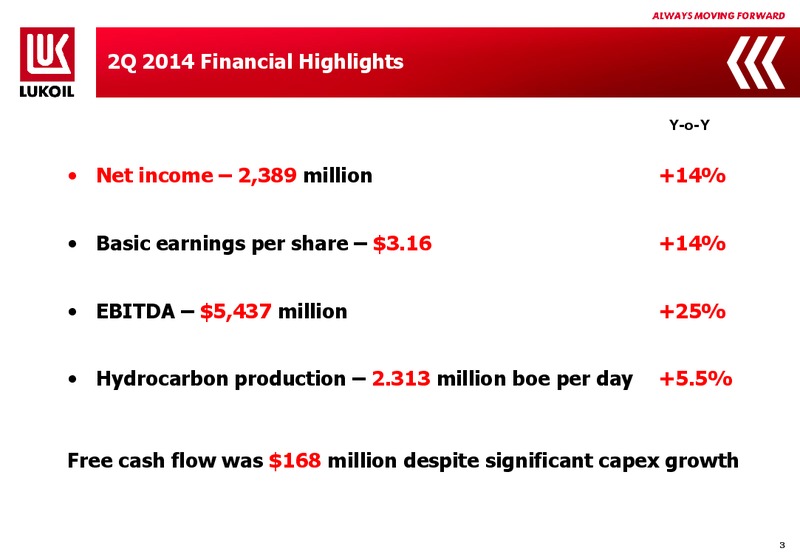
2Q 2014 Financial Highlights Y-o-Y Net income 2,389 million +14% Basic earnings per share 3.16 +14% EBITDA 5,437 million +25% Hydrocarbon production 2.313 million boe per day +5.5% Free cash flow was 168 million despite…
2Q 2014 Main Events Liquid hydrocarbon production growth +7.2% Including West Qurna-2 project Start of cost compensation in Iraq The first tanker with LUKOILs compensation oil departed from Iraq in August Construction of…
Macroeconomic and Tax Environment 2Q 2014 to 2Q 2013 Positive factors Gasoline (Europe); 6.60% Negative factors High-octane gasoline R (Russia); 5.40% E Urals; 5.30% V Diesel fuel (Europe); E 3.70% N Fuel oil (Europe); U…
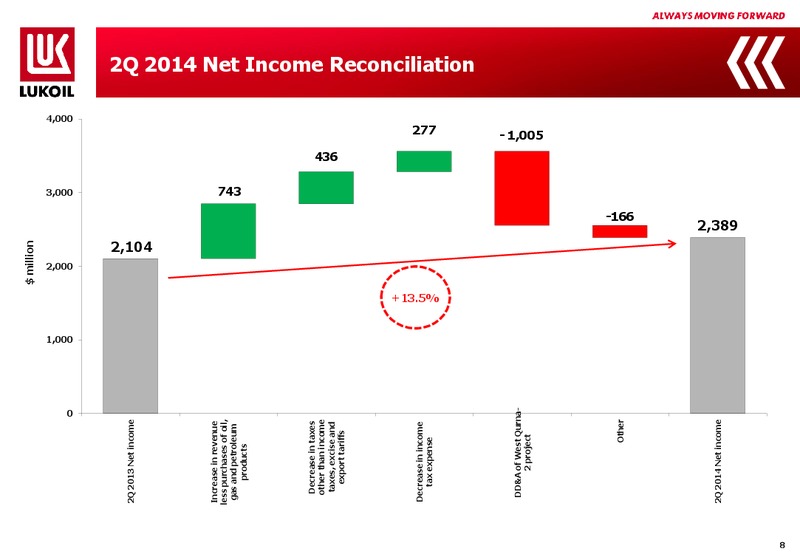
million 0 1,000 2,000 3,000 4,000 2Q 2013 Net income 2,104 Increase in revenue less purchases of oil, gas and petroleum 743 products Decrease in taxes other than income taxes, excise and 436 export…
Main Operating Results 2Q 2014 to 2Q 2013 Domestic crude oil sales; 31.5% Daily crude oil and natural gas liquids production*; 7.2% Positive factors Daily hydrocarbon Negative factors production*; 5.5% Domestic sales…
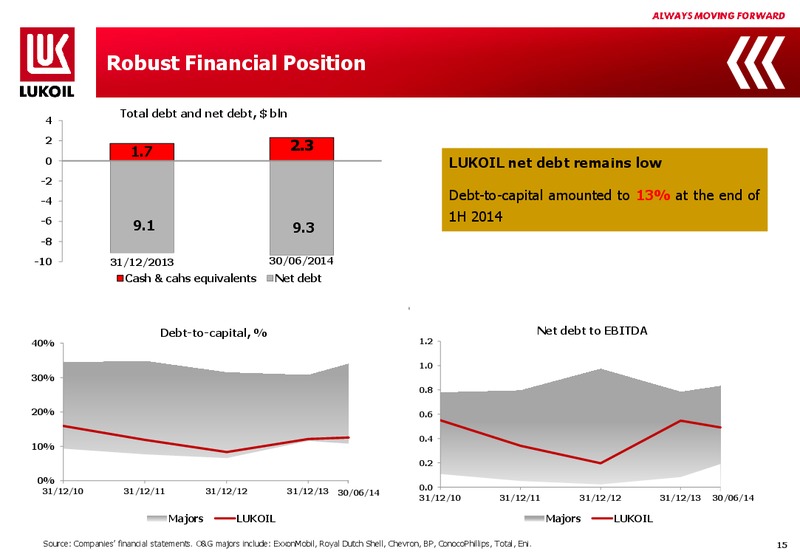
Robust Financial Position Total debt and net debt, bln 4 2 1.7 2.3 0 LUKOIL net debt remains low -2 -4 Debt-to-capital amounted to 13% at the end of -6 1H 2014 9.1 9.3 -8 -10 31/12/2013 30/06/2014 Cash & cahs equivalents Net…
CAPEX Structure 2Q 1Q 6M 6M , % million , % 2014 2014 2014 2013 3,445 2,725 26 Exploration and production 6,170 5,455 13 2,467 1,973 25 Russia 4,440 3,919 13 978 752 30 International 1,730 1,536 13 892 447 100 Refining and…
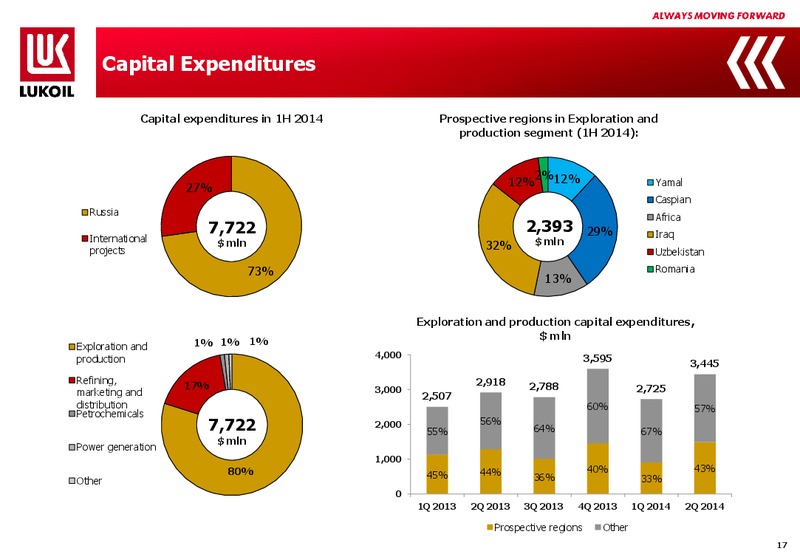
Capital Expenditures Capital expenditures in 1H 2014 Prospective regions in Exploration and production segment (1H 2014): 2% 12% 27% 12% Yamal Caspian Russia Africa 7,722 2,393 29% Iraq International mln mln projects 32%…
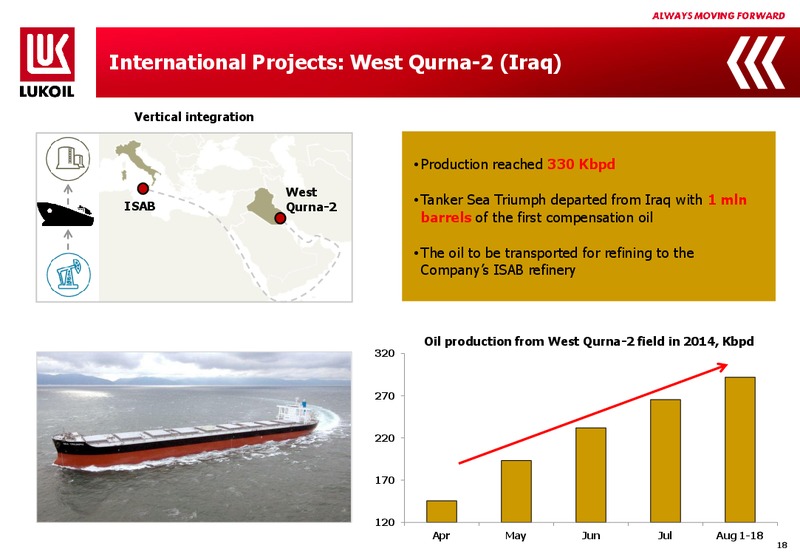
International Projects: West Qurna-2 (Iraq) Vertical integration Production reached 330 Kbpd West ISAB Qurna-2 Tanker Sea Triumph departed from Iraq with 1 mln barrels of the first compensation oil The oil to be transported for…
Timan-Pechora Timan-Pechora oil production, Kbpd 316 New oil wells put into operation +3.5% 309 in 1H 2014 increased for 28% 310 308 302 306 Production drilling increased for 301 295 298 74% 288 2Q 2013 3Q 2013 4Q 2013…
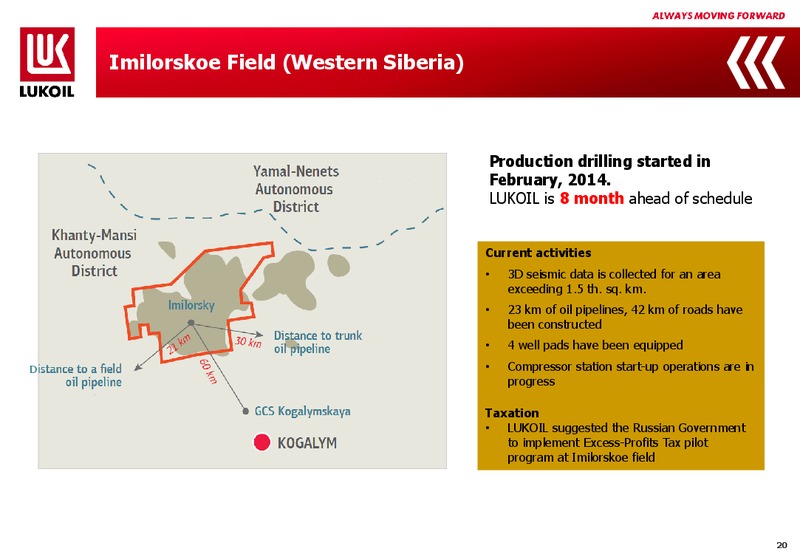
Imilorskoe Field (Western Siberia) Production drilling started in February, 2014. LUKOIL is 8 month ahead of schedule Current activities 3D seismic data is collected for an area exceeding 1.5 th. sq. km. 23 km of oil…
Northern Caspian: Filanovsky field IRP-1 IRP-1 LQP-1 CPP LQP-1 CPP RB RB Works in 2Q 2014: Plans for 2014: Transportation and installation at Finishing construction of IRP-1, the sea of the first of the platforms LQP-1,…
Uzbekistan Plans for 2014-2015: 2014 - launch of gas booster station Khauzak 15 MW capacity Completion of 25 wells, launch of gas Aral treatment units Kuvachy Alat and Northern Kungrad Shady, pipelines and other infrastructure…
Refining Facilities Modernization Nizhny Novgorod Perm Catalytic cracking Coking unit Capacity: 2.0 mln t/year Capacity: 2.1 mln t/year Economic effect in 2015-2016: Economic effect in 2015-2016: 0.4 bln 1 bln Volgograd…
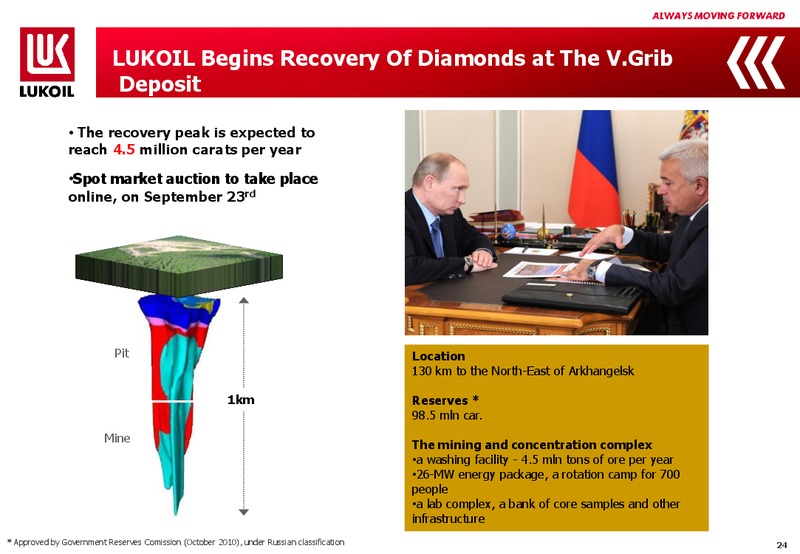
LUKOIL Begins Recovery Of Diamonds at The V.Grib Deposit The recovery peak is expected to reach 4.5 million carats per year Spot market auction to take place online, on September 23rd Pit Location 130 km to the North-East of…
The V.Grib Deposit is the Biggest New Pipe Under Development Major Players in 2013 / mln car. Main Existing Kimberlite Provinces, mln car. De Beers (7 bln) 47 Alrosa 37 88% Rio Tinto 16 Market Endiama 8 IR 1958 IHAL 1962 37…
Environmental Safety is Our Priority LUKOIL has received a highest international award, Environmental Tree, for cutting the negative impact of its fuel-and-energy facilities on the environment Waste water discharge, million…
Conclusion - Value creation and accelerating growth of dividends - Increasing efficiency of operating activities - ost control, and OPEX optimization - Maintaining conservative financial policy - Maintaining strong financial…
 Loading...