9M 2008 Financial Results (US GAAP) Leonid Fedun, Vice-President of LUKOIL December 2008
Executive Summary Best ever 9 months financial results Significant increase in free cash flow The Company controls production costs Increase in refinery throughputs (+8.3%) Increase in marketable gas production (+28%)…
9M 2008 Financial Highlights Sales 89,265 million (+56.3% y-o-y) EBITDA 16,652 million (+60.6%) Net income 10,765 million (+70.9%) Basic EPS 12.85 per share (+69.1%) Net income per boe of production 17.9 per boe (+69.7%)…
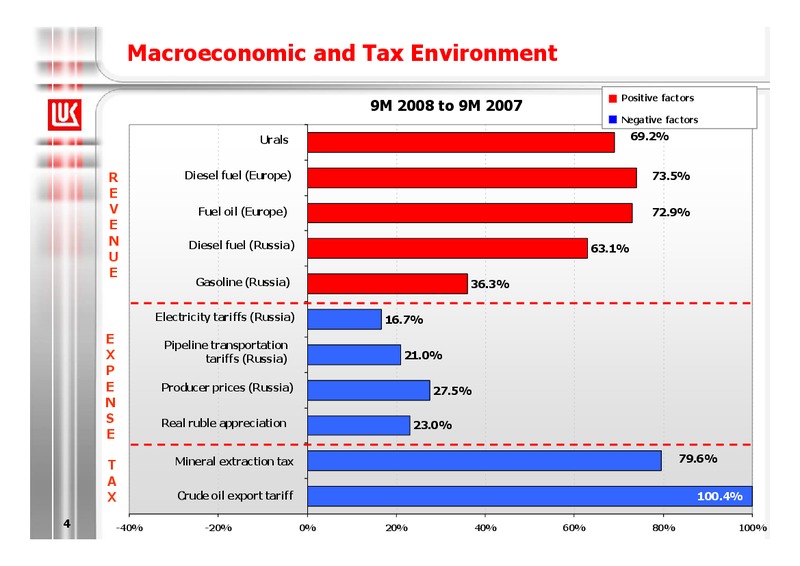
Macroeconomic and Tax Environment Positive factors 9M 2008 to 9M 2007 Negative factors Urals 69.2% R Diesel fuel (Europe) 73.5% E V Fuel oil (Europe) 72.9% E N Diesel fuel (Russia) 63.1% U E Gasoline (Russia) 36.3%…
Main Operating Results 9M 2008 to 9M 2007 (9M 2008 actual level) Oil production -2.6% (1,915 th. barrels per day) Marketable gas +28.0% (274 th. boe per day) production Marketable hydrocarbon +0.4% (2,189 th. boe per day)…
Strengthening Our Competitive Positions Lifting costs, per boe 10 +100% 8 6 +75% 4 +69% 2 2004 2005 2006 2007 9M 2008 LUKOIL Russian oil&gas companies* International oil&gas companies** CAPEX per boe of production,…
Securing Marketable Hydrocarbon Production Increase Thanks to New Regions Marketable hydrocarbon production, th. boe per day 2.27 Test launch of the Yuzhnaya Khylchuya field 2.17 2007 2008 Average for 2007 Average…
Accelerated Growth of Hydrocarbon Production in International Projects and Gas Production Marketable hydrocarbon production as part of international projects, th. boe per day Marketable gas production, th. boe per day 200 300 +88%…
Increase in Output of Products with High Value-Added Refinery throughputs reconciliation (y-o-y), Refining margin of Russian cracking refinery, th. barrels per day per barrel 1,150 45 1,123 40 24 1,100 35 25 30 37 1,050 1,037…
Steadily Increasing Retail Sales of Petroleum Products in Russia Retail sales volume of petroleum products, Volume of retail sales of mln tons petroleum products, mln tons 12 33% 42% +27% 8 4.39 2004 9M 2008 3.45 8.2 mln tons…
Financial Results 3Q 3Q 9M 9M ,% million ,% 2008 2007 2008 2007 32,555 21,415 +52.0 Total revenue 89,727 57,347 +56.5 (2,204) (1,555) +41.7 Operating expenses (5,882) (4,469) +31.6 Taxes other than income tax (10,938)…
Sales Breakdown, million 100,000 Domestic market Other sales 89,265 International market Sales of gas and gas products* 80,000 18% +64% Sales of petrochemicals in Russia 57,096 60,000 +55% Sales of crude oil in Russia…
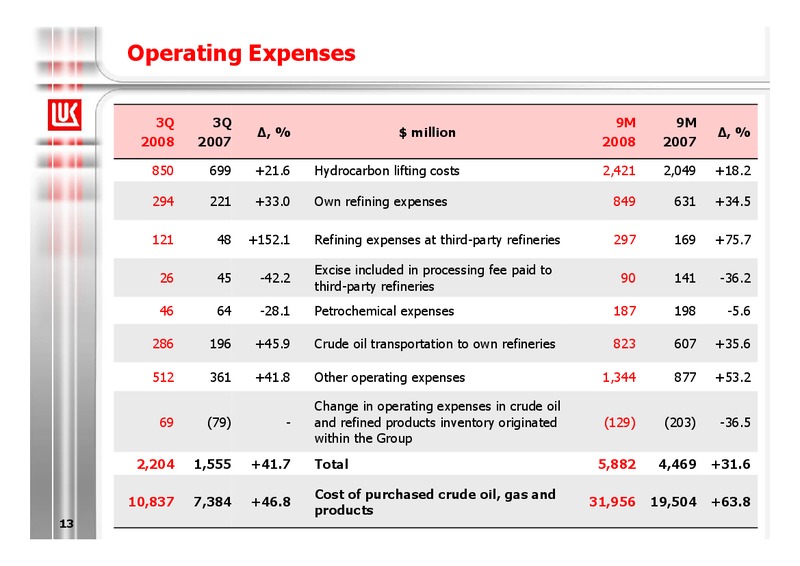
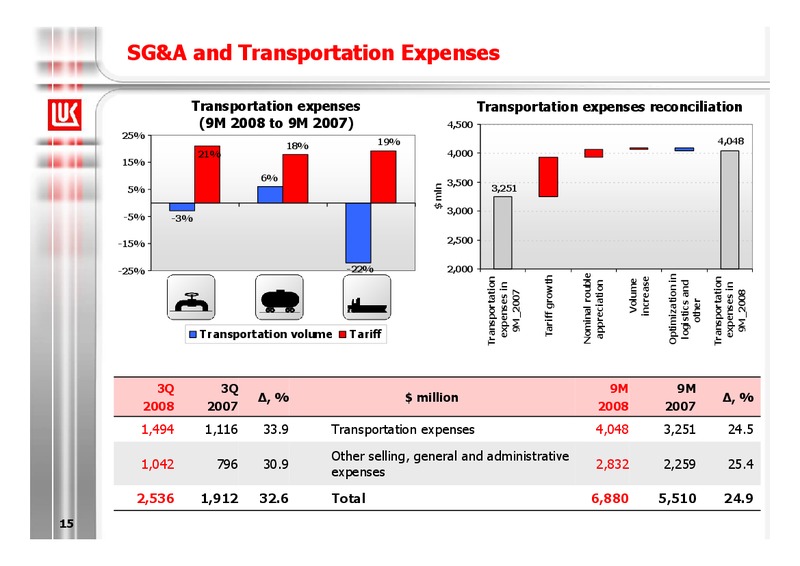
OPEX Growth Drivers The substantial growth of operating expenses y-o-y was caused by the Lifting costs, /boe following factors: 5.0 - real ruble appreciation, which reached 23% (9M 2008 to 9M 2007) and 4.31 4.29 affected all…
Tax Burden Tax expenses of LUKOIL Group and crude oil price 14,000 150 Mineral extraction tax and export tariffs comparison, /ton 400 12,000 379 300 189 200 158+100% 120 10,000 88 total tax expense, mln 100 +80%…
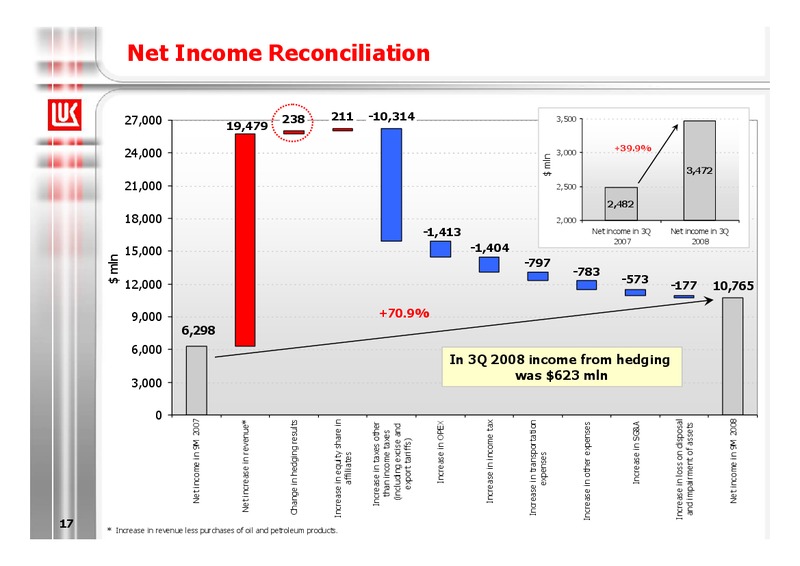
17 mln 0 12,000 15,000 18,000 21,000 24,000 27,000 3,000 6,000 9,000 Net income in 9M 2007 6,298 Net increase in revenue* 19,479 Change in hedging results 238 * Increase in revenue less purchases of…
18 mln 0 2,000 4,000 6,000 8,000 10,000 12,000 14,000 Cash at the beginning of the year 841 Operating activities 10,943 Net movements of long- 546 term debt Net movements of short- 338 term…
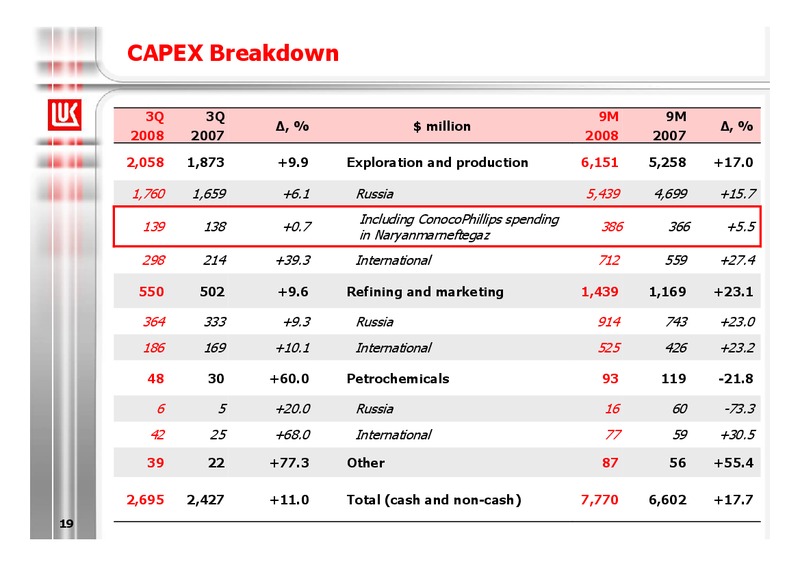
CAPEX Breakdown 3Q 3Q 9M 9M , % million , % 2008 2007 2008 2007 2,058 1,873 +9.9 Exploration and production 6,151 5,258 +17.0 1,760 1,659 +6.1 Russia 5,439 4,699 +15.7 Including ConocoPhillips spending 139 138 +0.7 386 366 +5.5…
The Main Task for 2009: Securing Positive Cash Flows Company focuses its attention on reducing costs and increasing cash flows in order to maintain investment attractiveness amid financial crisis and volatility of basic market…
OPEC Production Should Show Another Substantial Decrease in Order to Fuel Oil Price Recovery Supply and demand of crude oil in the world, mln bpd 90 OPEC declared production cut of 1.5 mln bpd in late October 88 Quota cut of…
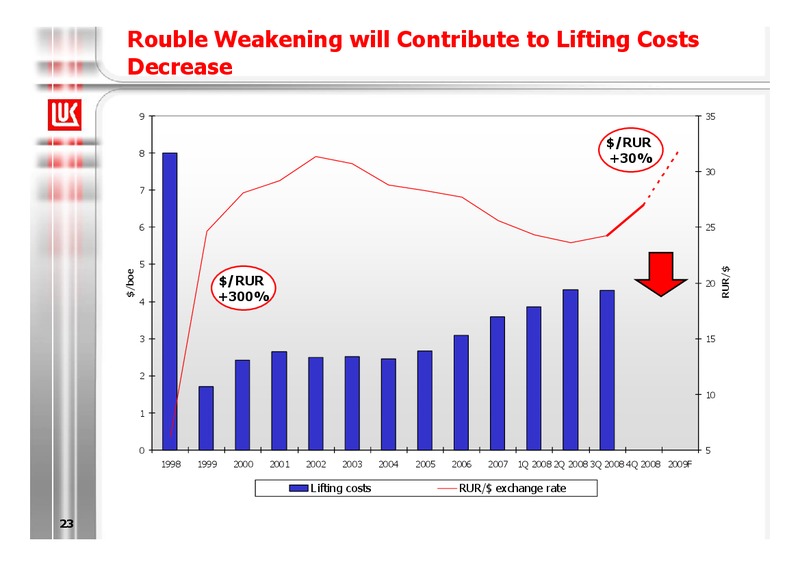
Costs Shown in Dollars Depend on the Exchange Rate Rouble/Dollar exchange rates for various LUKOIL OPEX in 2003-2007 oil prices % 20% 40 15% 35 Rouble/dolldar exchange rate 10% 30 5% 25 0% 20 -5% 15 -10% 10 -15%…
Tax Reduction On July 22, 2008 Russias President Dmitry Medvedev signed Amendments to the Tax Code effective from January 1, 2009: Change in the base oil price in the mineral extraction tax formula Introduction of tax holidays in…
Anti-Crisis Government Actions for Oil Industry Increasing amortization rate up to 30% for new projects Change in export tariff calculation methodology (calculation period was reduced to one month from December 1)…
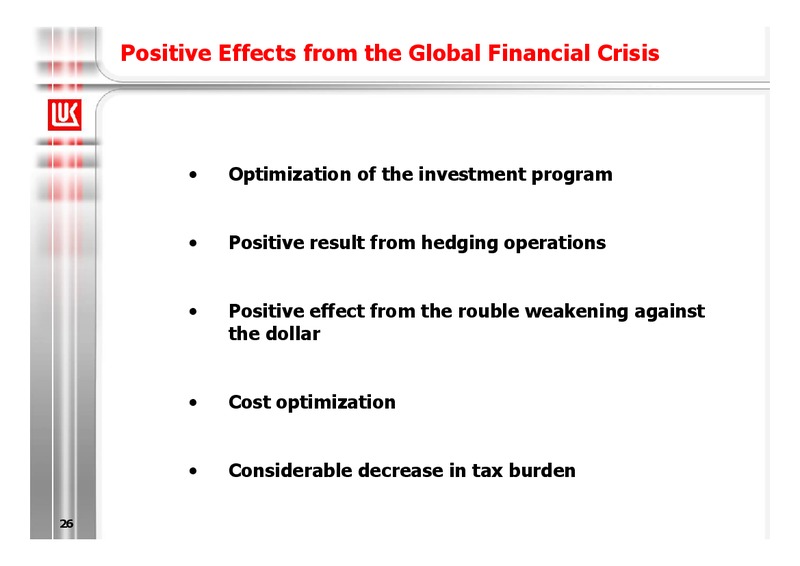
Positive Effects from the Global Financial Crisis Optimization of the investment program Positive result from hedging operations Positive effect from the rouble weakening against the dollar Cost optimization…
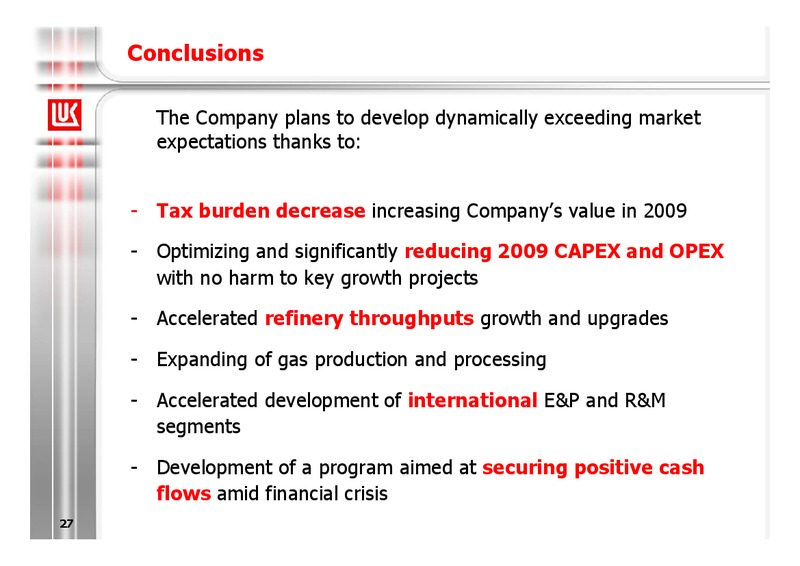
Conclusions The Company plans to develop dynamically exceeding market expectations thanks to: - Tax burden decrease increasing Companys value in 2009 - Optimizing and significantly reducing 2009 CAPEX and OPEX with no harm to…
 Loading...