1H 2008 Financial Results (US GAAP) Leonid Fedun, Vice-President of LUKOIL August 2008
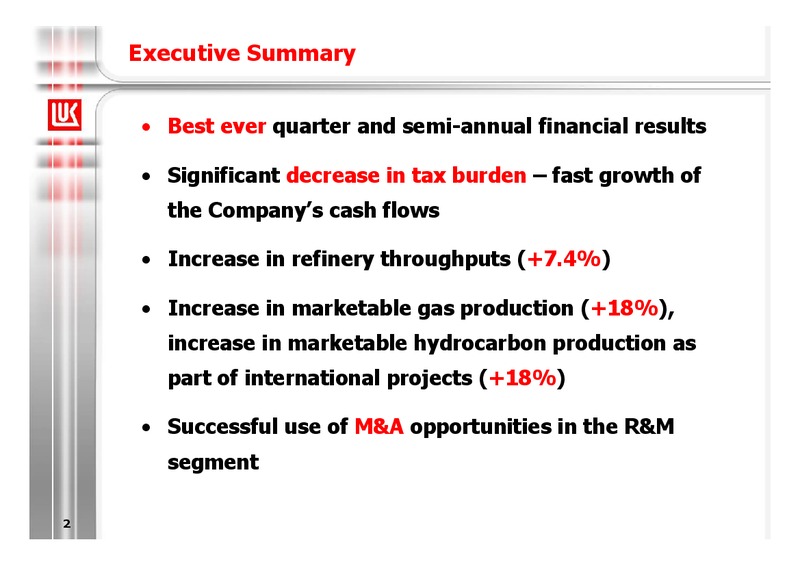
Executive Summary Best ever quarter and semi-annual financial results Significant decrease in tax burden fast growth of the Companys cash flows Increase in refinery throughputs (+7.4%) Increase in marketable gas production…
1H 2008 Financial Highlights Sales 56,890 million (+59.0% y-o-y) EBITDA 11,082 million (+74.5%) Net income (excluding hedging and impairment losses) 8,168 million (+103.5%) Reported net income 7,293 million (+91.1%) Basic EPS…
Macroeconomic and Tax Environment Positive factors 1H 2008 to 1H 2007 Negative factors Urals 76.5% R Diesel fuel (Europe) 80.0% E V Fuel oil (Europe) 74.7% E N U Diesel fuel (Russia) 65.6% E Gasoline (Russia) 41.2%…
Main Operating Results 1H 2008 to 1H 2007 (1H 2008 actual level) Oil production -3.8% (1,905 th. barrels per day) Marketable gas +18.3% (271 th. production boe per day) Marketable hydrocarbon -1.5% (2,176 th. boe per day)…
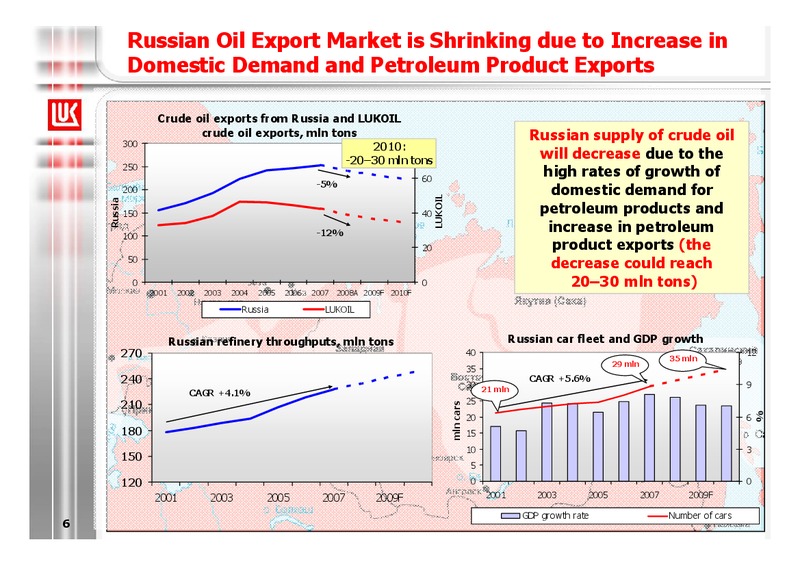
Russian Oil Export Market is Shrinking due to Increase in Domestic Demand and Petroleum Product Exports Crude oil exports from Russia and LUKOIL 300 crude oil exports, mln tons Russian supply of crude oil 2010: 80 -2030 mln tons…
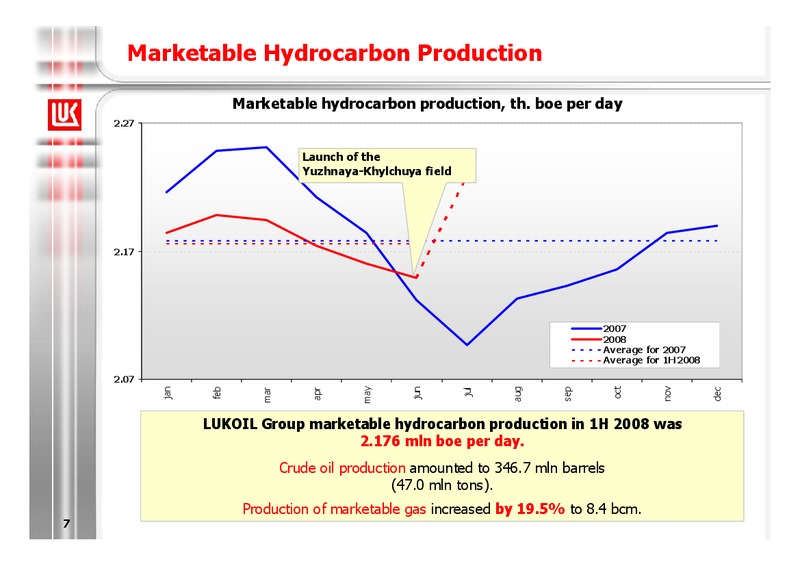
Marketable Hydrocarbon Production Marketable hydrocarbon production, th. boe per day 2.27 Launch of the Yuzhnaya-Khylchuya field 2.17 2007 2008 Average for 2007 Average for 1H 2008 2.07 may nov oct jan…
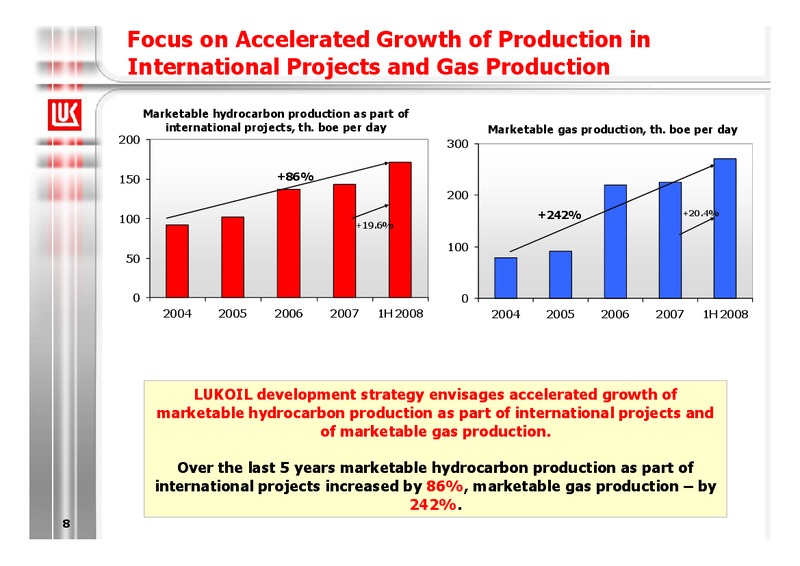
Focus on Accelerated Growth of Production in International Projects and Gas Production Marketable hydrocarbon production as part of international projects, th. boe per day Marketable gas production, th. boe per day 200 300 150…
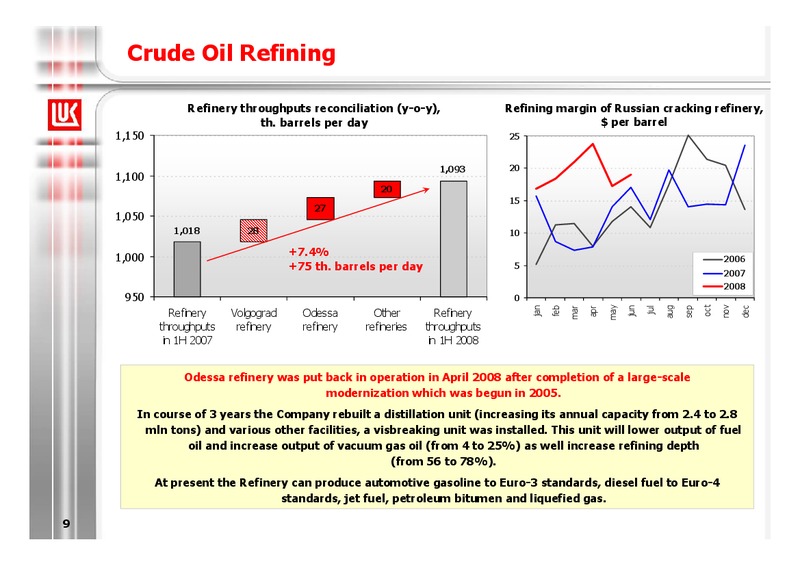
Crude Oil Refining Refinery throughputs reconciliation (y-o-y), Refining margin of Russian cracking refinery, th. barrels per day per barrel 1,150 25 1,093 20 1,100 20 15 27 1,050 1,018 28 10 1,000 +7.4% 2006 +75 th.…
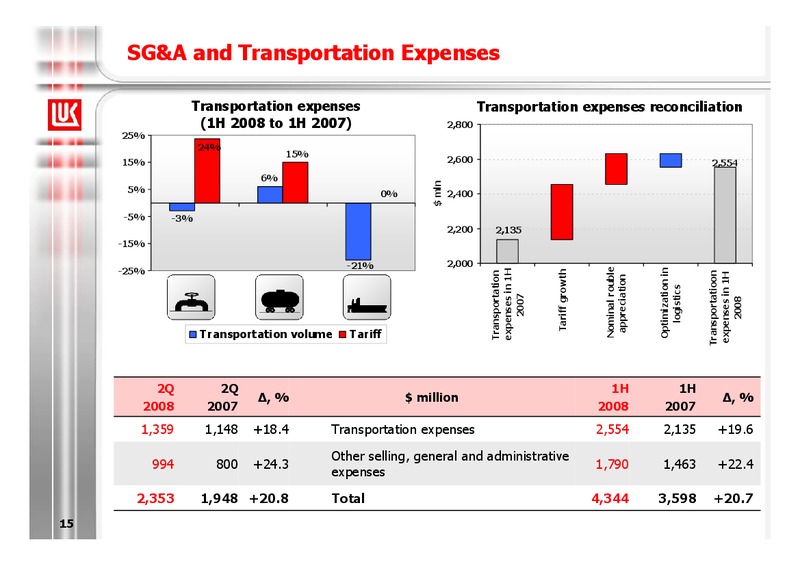
Financial Results 2Q 2Q 1H 1H ,% million ,% 2008 2007 2008 2007 32,088 20,196 +58.9 Total revenue 57,172 35,932 +59.1 (1,770) (1,471) +20.3 Operating expenses (3,678) (2,914) +26.2 Taxes other than income tax (including…
Sales Reconciliation 60 1.0 0.4 -0.1 56.9 19.8 55 50 bln 45 +59.0% 40 35.8 35 Total sales in Change in prices Increase in other Change in sales Change in volumes Total sales in 11 1H_2007 sales mix sold 1H_2008
Sales Breakdown, million 60,000 56,890 International sales of crude oil (excluding near-abroad countries) 12,199 Exports of crude oil in near-abroad 24% countries +45.3% 868 330 Sales of crude oil in Russia 40,000 35,781…
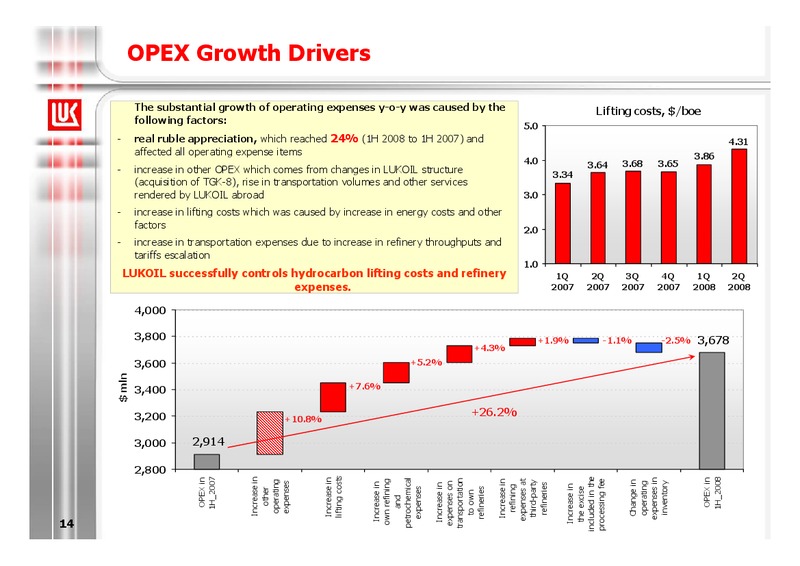
OPEX Growth Drivers The substantial growth of operating expenses y-o-y was caused by the Lifting costs, /boe following factors: 5.0 - real ruble appreciation, which reached 24% (1H 2008 to 1H 2007) and 4.31 affected all operating…
Tax Burden Tax expenses of LUKOIL Group and crude oil price 12,000 140 Mineral extraction tax and export tariffs comparison, /ton 350 337 280 210 175 155 9,000 +92% 115 140 81 Total tax expense, mln 70 +90% oil…
17 mln 0 12,000 15,000 18,000 3,000 6,000 9,000 Net income in 1H 2007 3,816 Net increase in revenue* 12,631 Increase in equity share 131 in affiliates * Increase in revenue less purchases of oil…
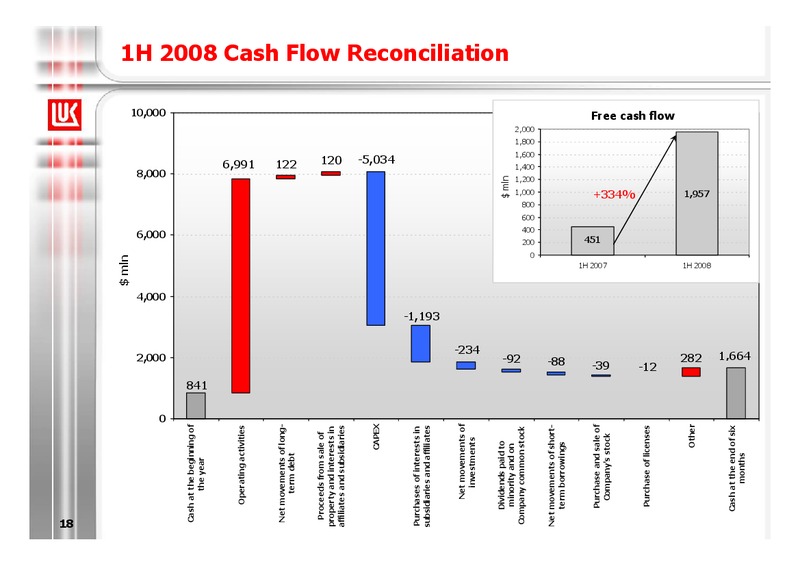
18 mln 0 2,000 4,000 6,000 8,000 10,000 Cash at the beginning of the year 841 Operating activities 6,991 Net movements of long- term debt 122 Proceeds from sale of property and interests in 120…
CAPEX Breakdown 2Q 2Q 1H 1H , % million , % 2008 2007 2008 2007 2,112 1,669 +26.5 Exploration and production 4,093 3,385 +20.9 1,900 1,475 +28.8 Russia 3,679 3,040 +21.0 Including ConocoPhillips spending 96 105 -8.6 247 228…
Tax Reduction On July 22, 2008 Russias President Dmitry Medvedev signed Amendments to the Tax Code effective from January 1, 2009: Change in the base oil price in the mineral extraction tax formula Introduction of tax holidays in…
Change in the Base Oil Price Base tax rate (Oil price Base oil price) Reserve exhaustion rate MET = Base exchange rate (RUR/USD) Base oil price Base oil price is increased from 9 to 15/barrel: 419 (monthly average Urals price in…
MET (Royalty) Tax Holidays The Law envisages tax holidays* in a number of regions: to the north of Polar Circle, entirely or partly within inland sea waters and on the continental shelf of Russia in the offshore Azov and Caspian…
Tax Relieves for Fields with High Depletion Levels LUKOIL output subject to the relieves (mln tons) and the amount of remissions ( mln) 2009 2010 2011 2012 2013 2014 2015 2016 2017 Total Output, 8.8 8.2 8.5 12.1 12.0 11.4 11.4…
Tax Relieves for Fields with High-Viscosity Oil LUKOIL output subject to the relieves (mln tons) and the amount of remissions ( mln) 2009 2010 2011 2012 2013 2014 2015 2016 2017 Total Output, 2.3 2.3 2.5 3.0 4.1 4.6 4.6 4.5 4.5…
Total Tax Relieves Effect Cumulative effect from application of the tax relieves in 20092017, bln 10 8.4 8 6.6 The effect from 6 application of the tax 5.0 4.1 relieves for LUKOIL is 4 estimated at 2 2427 bln 0 in…
Further Steps to Decrease Tax Burden in Russia (under consideration) Increase in base oil price in the export tariff formula from 15 to 25 per barrel Single export tariff rate for light and dark petroleum products Change in…
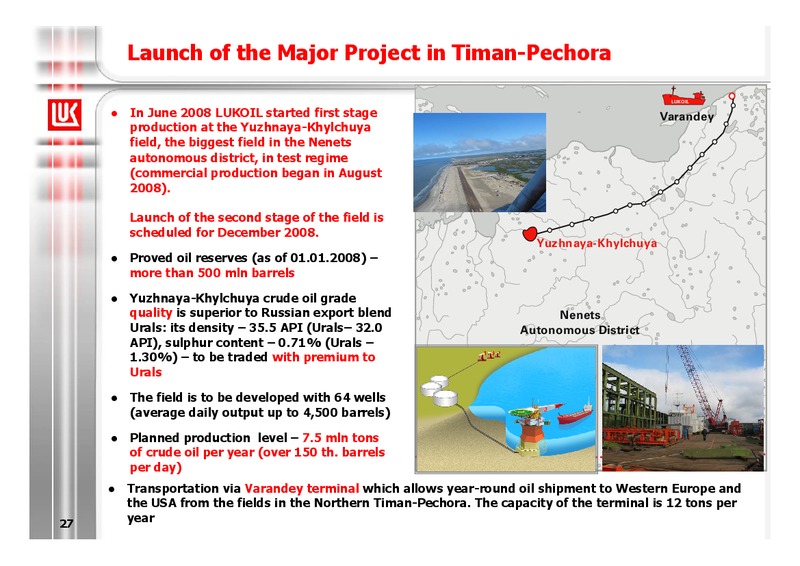
Launch of the Major Project in Timan-Pechora LUKOIL In June 2008 LUKOIL started first stage Varandey production at the Yuzhnaya-Khylchuya field, the biggest field in the Nenets autonomous district, in test regime (commercial…
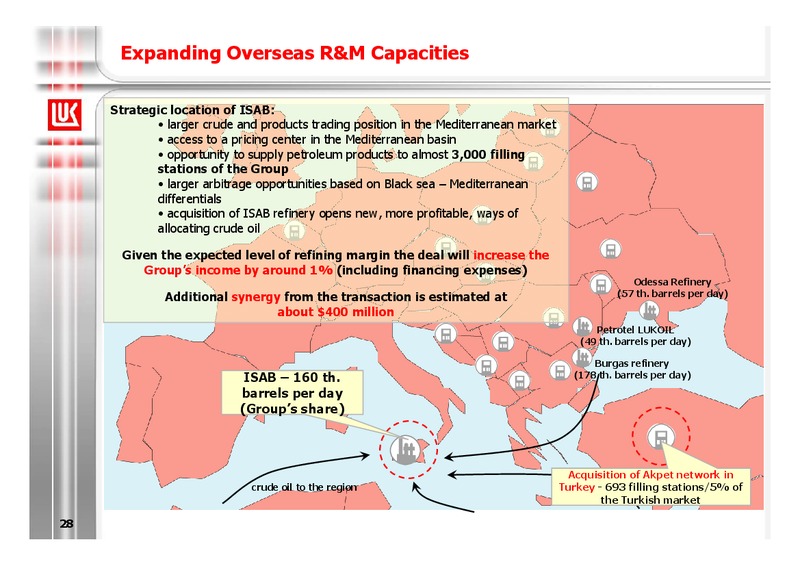
Expanding Overseas R&M Capacities Strategic location of ISAB: larger crude and products trading position in the Mediterranean market access to a pricing center in the Mediterranean basin opportunity to supply petroleum products to…
Conclusions The Company plans to develop dynamically exceeding market expectations thanks to: - Tax burden decrease - Accelerated refinery throughputs growth - Gas production and processing expanding - Cooperation with state…
 Loading...