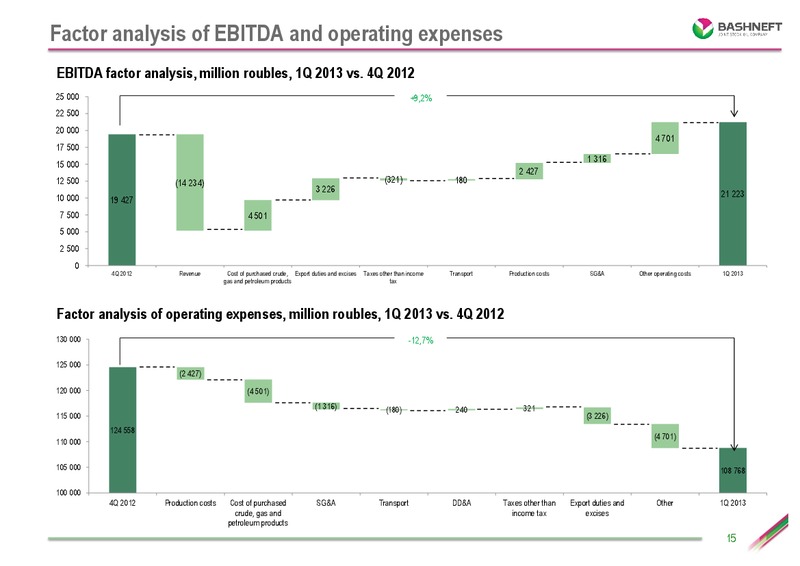
Bashneft Group IFRS results for the first quarter of 2013
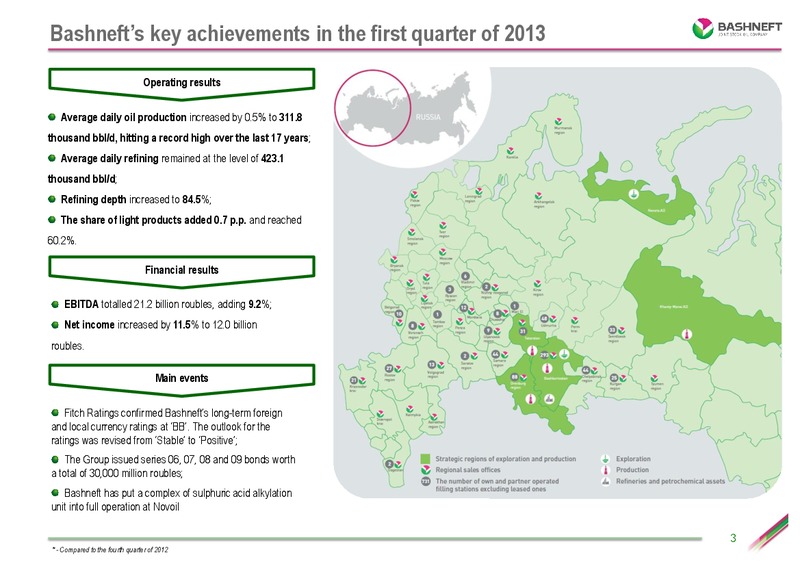
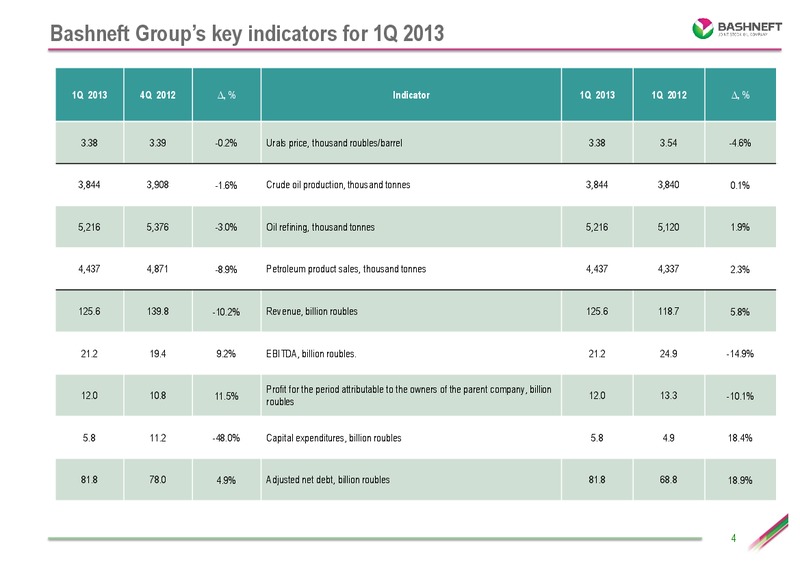
Bashnefts key achievements in the first quarter of 2013 Operating results Average daily oil production increased by 0.5% to 311.8 thousand bbl/d, hitting a record high over the last 17 years; Average daily refining remained at the…
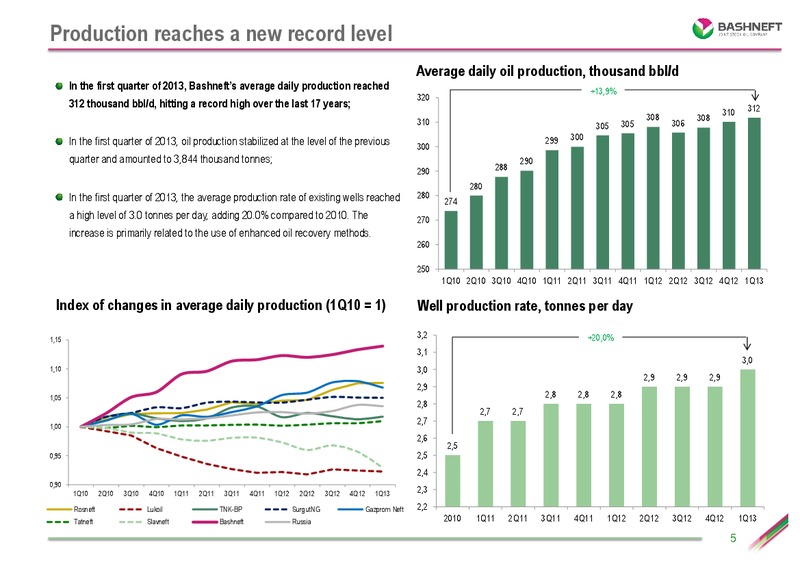
Production reaches a new record level Average daily oil production, thousand bbl/d In the first quarter of 2013, Bashnefts average daily production reached +13,9% 320 312 thousand bbl/d, hitting a record high over the last 17 years;…
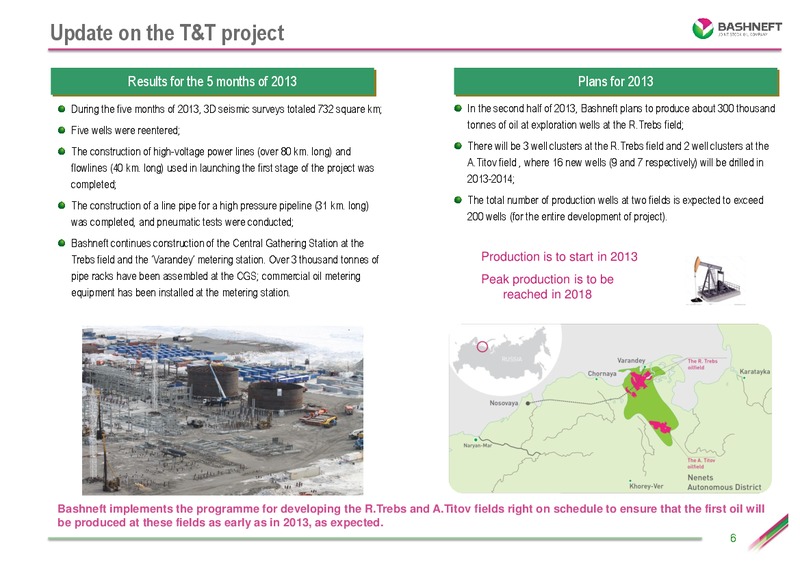
Update on the T&T project Results for the 5 months of 2013 Plans for 2013 During the five months of 2013, 3D seismic surveys totaled 732 square km; In the second half of 2013, Bashneft plans to produce about 300 thousand Five wells…
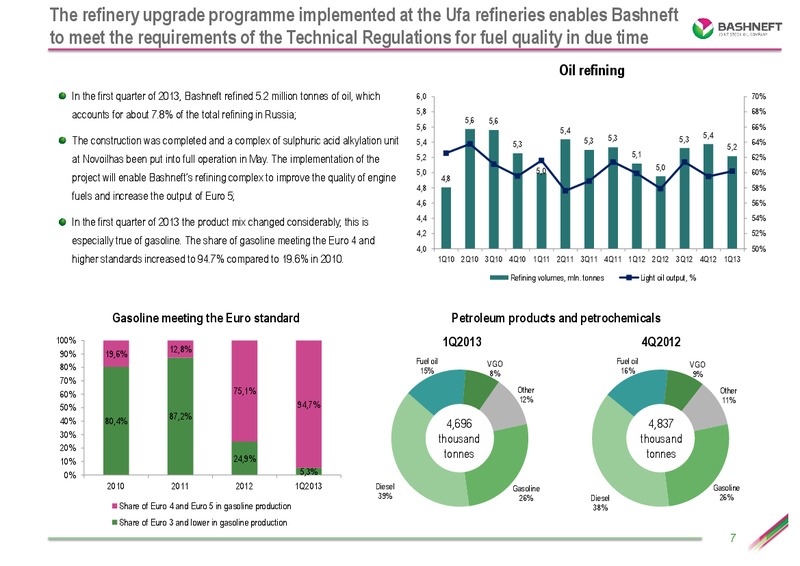
The refinery upgrade programme implemented at the Ufa refineries enables Bashneft to meet the requirements of the Technical Regulations for fuel quality in due time Oil refining In the first quarter of 2013, Bashneft refined 5.2 million…
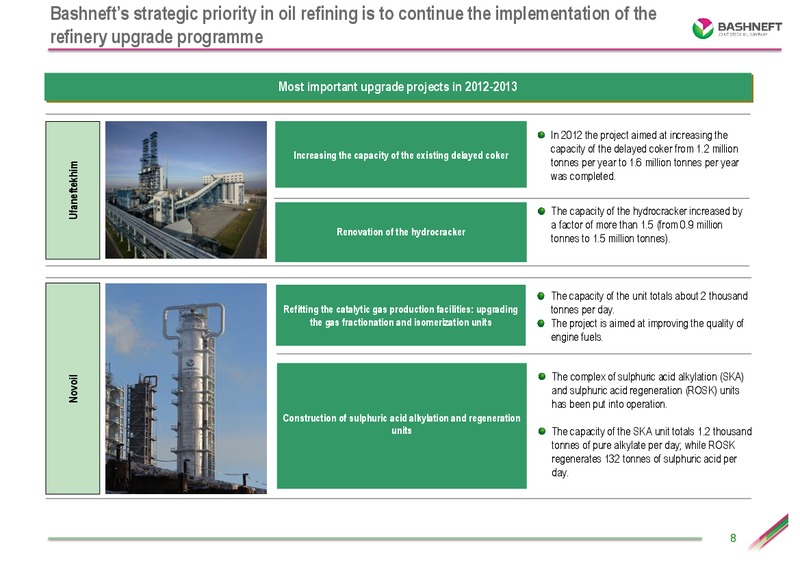
Bashnefts strategic priority in oil refining is to continue the implementation of the refinery upgrade programme Most important upgrade projects in 2012-2013 In 2012 the project aimed at increasing the capacity of the delayed coker…
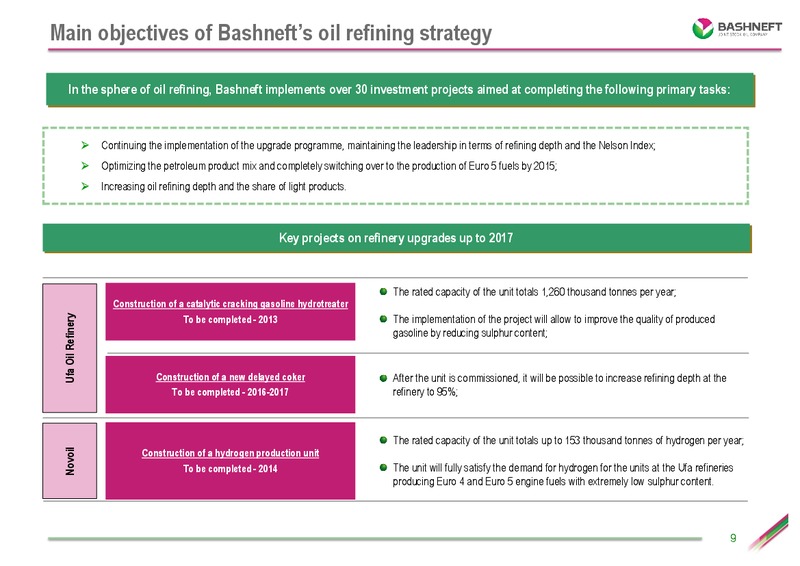
Main objectives of Bashnefts oil refining strategy In the sphere of oil refining, Bashneft implements over 30 investment projects aimed at completing the following primary tasks: Continuing the implementation of the upgrade…
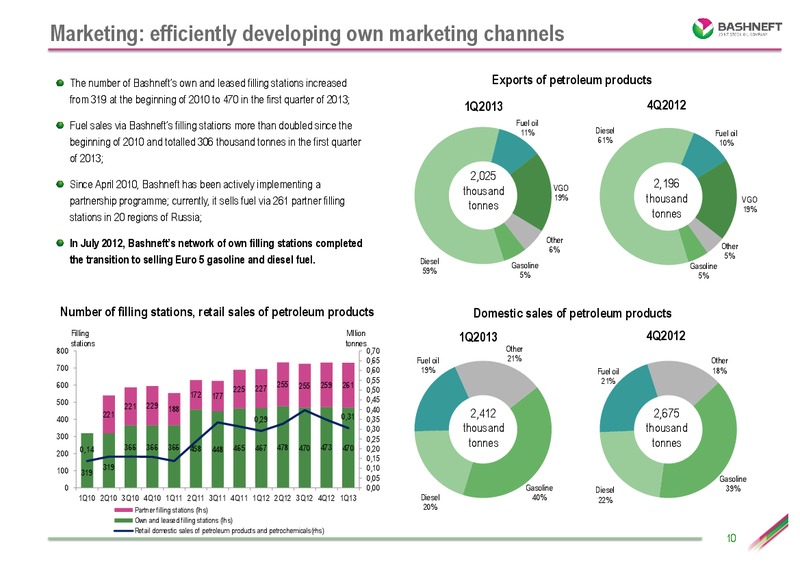
Marketing: efficiently developing own marketing channels The number of Bashnefts own and leased filling stations increased Exports of petroleum products from 319 at the beginning of 2010 to 470 in the first quarter of 2013; 1Q2013…
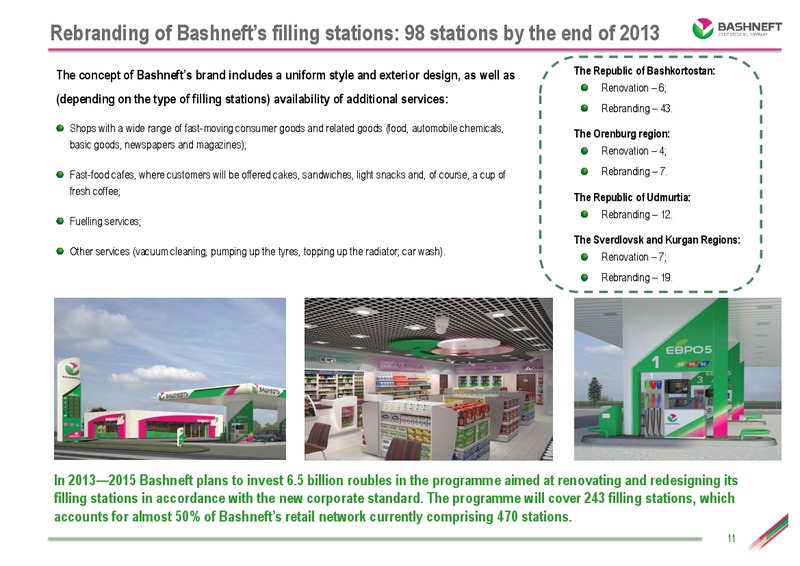
Rebranding of Bashnefts filling stations: 98 stations by the end of 2013 The concept of Bashnefts brand includes a uniform style and exterior design, as well as The Republic of Bashkortostan: Renovation 6; (depending on the type of…
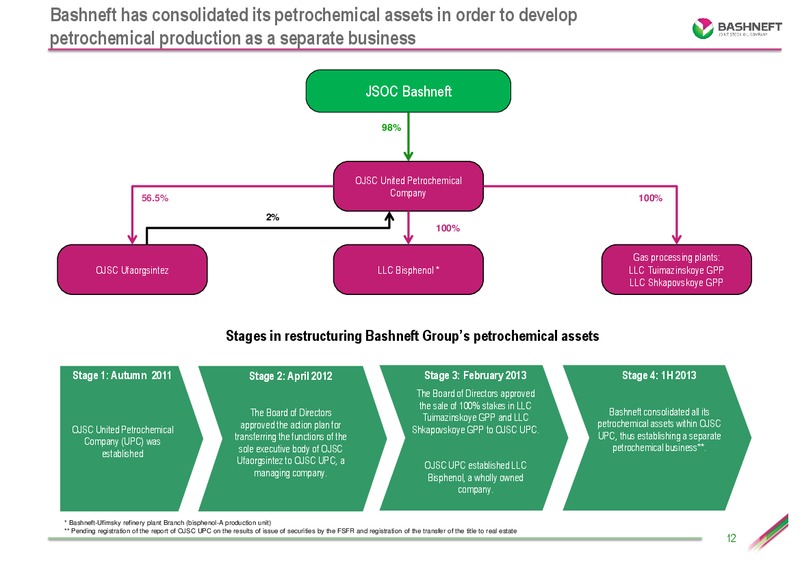
Bashneft has consolidated its petrochemical assets in order to develop petrochemical production as a separate business JSOC Bashneft 98% OJSC United Petrochemical 56.5% Company 100% 2% 100% Gas processing plants: OJSC…
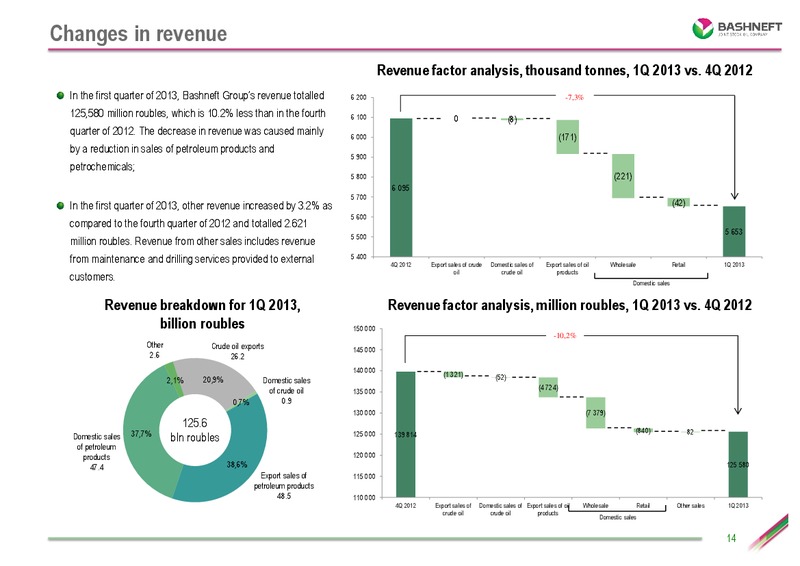
Changes in revenue Revenue factor analysis, thousand tonnes, 1Q 2013 vs. 4Q 2012 In the first quarter of 2013, Bashneft Groups revenue totalled 6 200 -7,3% 125,580 million roubles, which is 10.2% less than in the fourth 6 100 0 (8)…
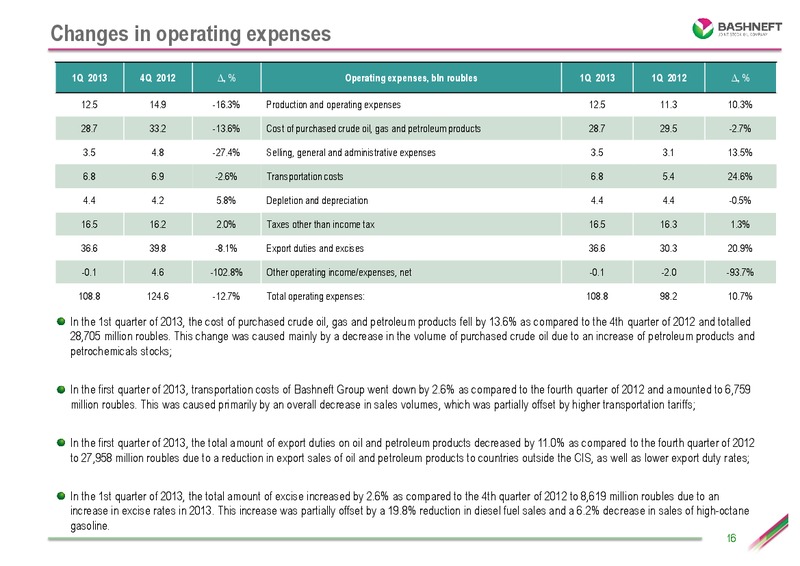
Changes in operating expenses 1Q 2013 4Q 2012 , % Operating expenses, bln roubles 1Q 2013 1Q 2012 , % 12.5 14.9 -16.3% Production and operating expenses 12.5 11.3 10.3% 28.7 33.2 -13.6% Cost of purchased crude oil, gas and petroleum…
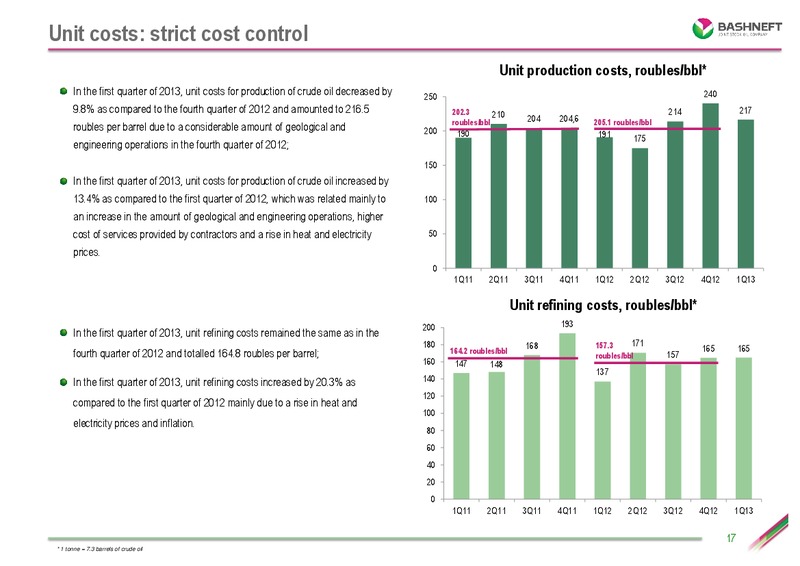
Unit costs: strict cost control Unit production costs, roubles/bbl* In the first quarter of 2013, unit costs for production of crude oil decreased by 250 240 9.8% as compared to the fourth quarter of 2012 and amounted to 216.5 202.3…
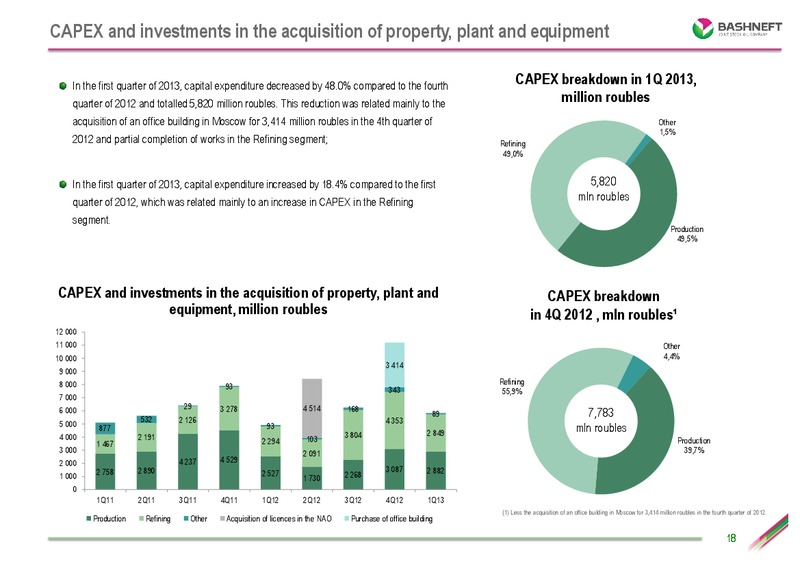
CAPEX and investments in the acquisition of property, plant and equipment In the first quarter of 2013, capital expenditure decreased by 48.0% compared to the fourth CAPEX breakdown in 1Q 2013, quarter of 2012 and totalled 5,820…
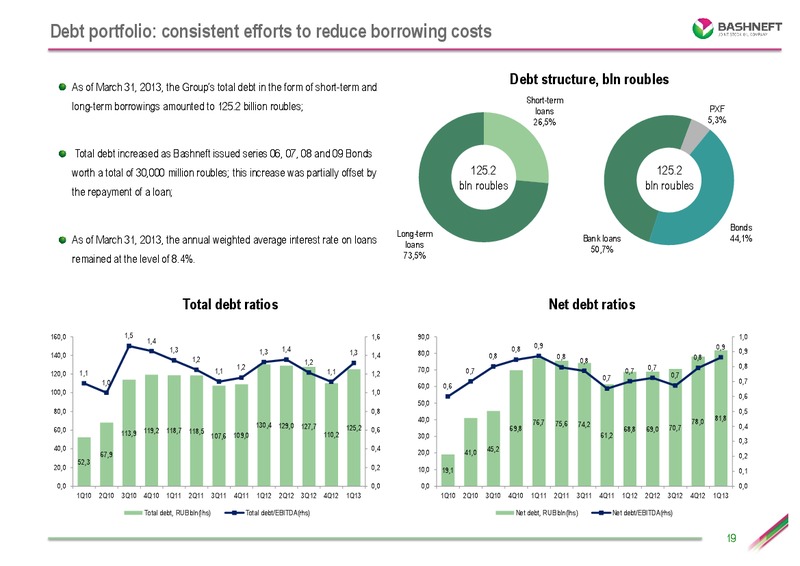
Debt portfolio: consistent efforts to reduce borrowing costs As of March 31, 2013, the Groups total debt in the form of short-term and Debt structure, bln roubles Short-term long-term borrowings amounted to 125.2 billion roubles;…
Thanks for your attention 5, 1-st Tverskaya-Yamskaya, Moscow, 125047, Russia Tel: +7 495 228 15 96 Fax: + 7 495 228 15 97 irbashneft.ru
 Loading...