Second Quarter 2010 Earnings Steve Malcolm Chairman and CEO July 29, 2010 2010 The Williams Companies, Inc. All rights reserved.
Oil and gas reserves and resource potential disclaimer The SEC requires oil and gas companies, in filings made with the SEC, to disclose proved reserves, which are those quantities of oil and gas, which, by analysis of geoscience and…
Highlights 2Q recurring adjusted EPS up 35% on strength of higher NGL and olefin margins 2Q production marks resumption of expected growth 12% in 2011, 16% in 2012 Expanding Marcellus position in all lines of business Seeing high…
E&P production growth 1,800 Expect to grow total production 1,600 30% from 2010 to 2012 1,400 Growth focus 1,200 Marcellus - 6% of total volumes in 2011 MMcfe/d 1,000 - 12% of total volumes in 2012 800 - Greater than 500…
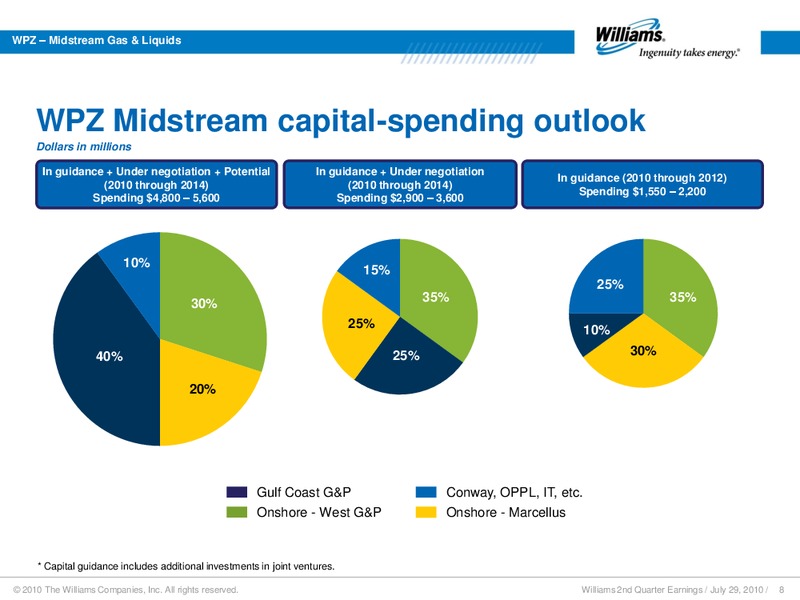
WPZ Midstream Gas & Liquids WPZ Midstream capital-spending outlook Dollars in millions In guidance + Under negotiation + Potential In guidance + Under negotiation In guidance (2010 through 2012) (2010 through 2014) (2010 through…
WPZ Gas Pipeline growth 1.3+ billion inventory Jackson Prairie Phased 07- 12 NE Connector/ Rockaway Lateral Nov. 13 NE Supply Link Blue Bridge Nov. 13 TBD Sundance Trail Opal Market Link Keystone Connector Nov. 10 TBD TBD…
Growing Marcellus position in all businesses Doubled E&P lease acreage with acquisition Adding rigs, ramping up drilling activity Contracted for 2 additional fit-for-purpose rigs Growing to 2nd largest producing basin by 2013…
Growth ahead at Overland Pass NGL Pipeline WPZ increasing interest to 50% Option to operate 425 million transaction 1,035-mile pipeline Nearly full now; expandable to 255,000 bbls Announced expansions grow capacity 65% in 2013…
Rockies basis outlook; exposure modest Rockies basis forward Rockies Basis Forward Market 0.00 market for 2011 and 2012 /Mcf 2011 2012 now averages 0.50 (0.20) E&Ps exposure on revenue (0.40) basis is modest as result of…
Estimated effect of drilling moratorium modest at WPZ Estimated Financial Effect of Drilling Moratorium Segment Profit + DD&A; s in Millions Duration 2010 2011 2012 6 months (10) (50) 20 With expected (expected) 6-month…
NGL, ethane price outlook is favorable Drivers of 2Q ethane margins vs. 1Q 3rd-party ethylene-cracking outages caused ethane bottleneck in 2Q Tight squeeze at Conway market in Midcontinent WMB ethane advantages We are low-cost…
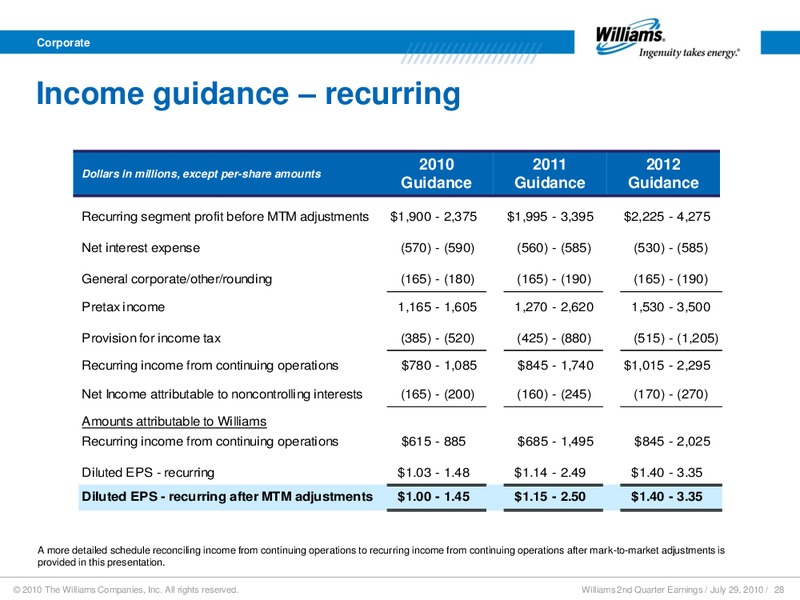
Financial guidance update Earnings guidance 2010 midpoint moves down 0.05 cents to 1.23 on lower NGL margins and Perdido Norte start-up delay 2011 and 2012 unchanged; however if recent weaker economy and commodity price environment…
2010 priorities for value creation Bring infrastructure projects online Williams Partners Perdido Norte Mobile Bay South Echo Springs TXP-4 Sundance Trail Phase 1 of 85 North Expansion Markham Expansion Laurel Mountain…
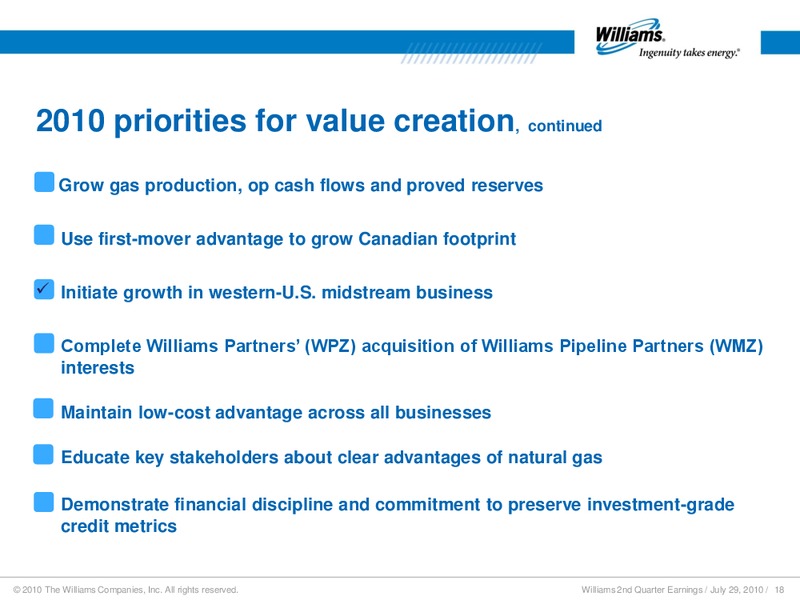
2010 priorities for value creation, continued Grow gas production, op cash flows and proved reserves Use first-mover advantage to grow Canadian footprint Initiate growth in western-U.S. midstream business Complete Williams…
Why Williams is a winning investment Assets Premier assets in growth areas Integrated businesses deliver value and competitive advantage Execution Executing on a wealth of value-creating opportunities in all businesses…
2010 The Williams Companies, Inc. All rights reserved.
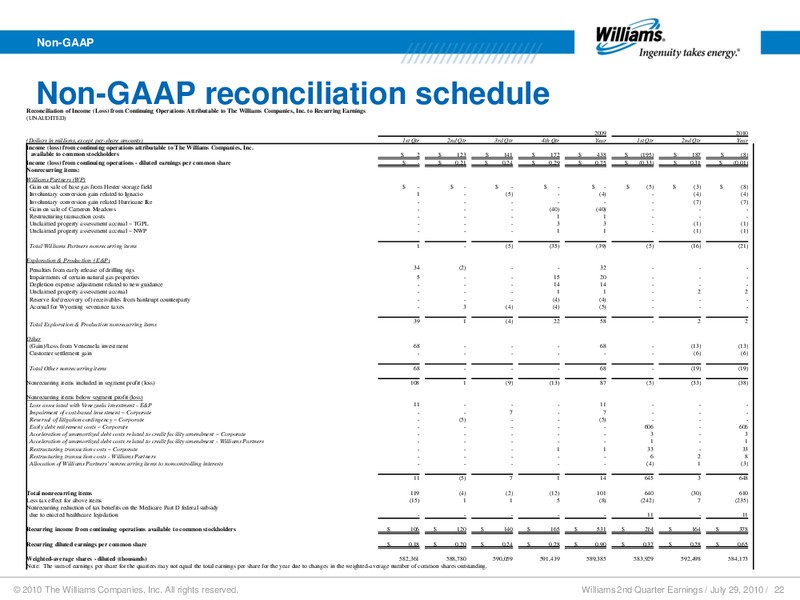
Non-GAAP Non-GAAP reconciliation schedule Reconciliation of Income (Loss) from Continuing Operations Attributable to The Williams Companies, Inc. to Recurring Earnings (UNAUDITED) 2009 2010 (Dollars in millions, except…
Non-GAAP Non-GAAP reconciliation schedule recurring segment profit Reconciliation of Segment Profit (Loss) to Recurring Segment Profit (Loss) (UNAUDITED) 2009 2010 (Dollars in millions) 1st Qtr 2nd Qtr 3rd Qtr 4th Qtr Year 1st…
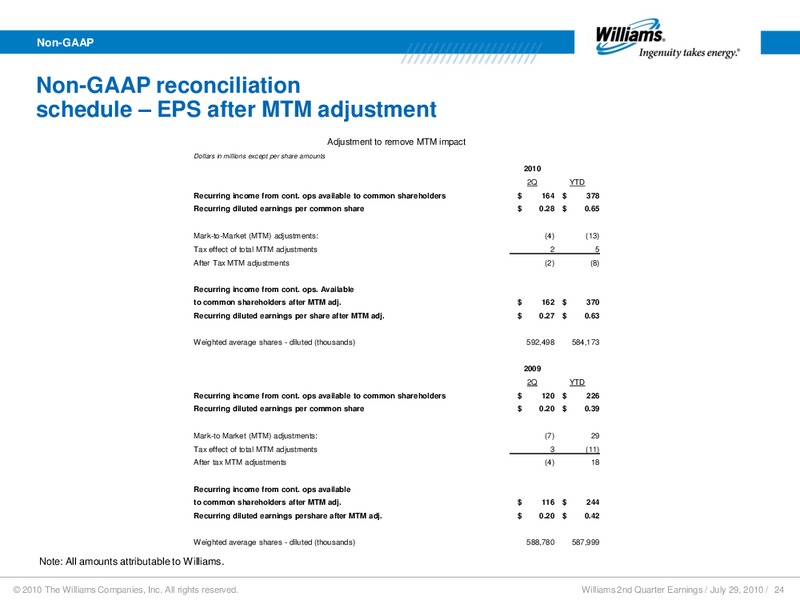
Non-GAAP Non-GAAP reconciliation schedule EPS after MTM adjustment Adjustment to remove MTM impact Dollars in millions except per share amounts 2010 2Q YTD Recurring income from cont. ops available to common shareholders 164…
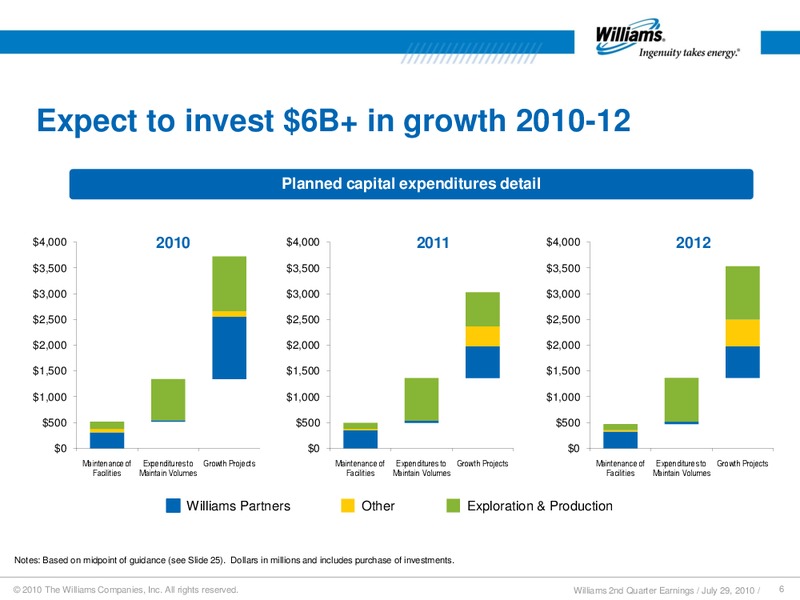
Corporate Capital expenditures guidance Dollars in millions 2010 2011 2012 Guidance Guidance Guidance Williams Partners (WPZ) 1,410 - 1,680 830 - 1,180 805 - 1,155 975 - 1,225 725 - 1,075 1,205 Exploration & Production…
Corporate Forecast guidance contribution Dollars in millions, except per-share amounts 2010 2011 2012 Income from continuing operations: 229 - 499 685 - 1,495 845 - 2,025 Non-recurring items (pretax) 610 Less taxes 224…
Non-GAAP Reconciliation Segment profit guidance reported to recurring Dollars in millions 2010 Guidance 2011 Guidance 2012 Guidance Low Midpoint High Low Midpoint High Low Midpoint High Reported Segment Profit: Williams Partners…
 Loading...