Third Quarter 2011 Earnings Alan Armstrong, Chief Executive Officer and Travis Campbell, Vice President Investor Relations November 1, 2011 2011 The Williams Companies, Inc. All rights reserved.
Oil and gas reserves and resource potential disclaimer The SEC requires oil and gas companies, in filings made with the SEC, to disclose proved reserves, which are those quantities of oil and gas, which, by analysis of geoscience and…
Executing on plan to unlock value Creating separate exploration and production company Preparing for year-end 2011 tax-free spinoff New, independent company WPX Energy Strong growth in cash flows from our energy infrastructure…
Strong financial performance Delivered 48% higher 3Q adjusted consolidated segment profit Strong performance across all businesses Williams Partners Midstream Exploration (WPZ) Canada & Olefins & Production 36% higher adjusted…
Recent growth investments performing Gulf Perdido Norte volumes increasing Markham nearly full; connected Transco and a third-party pipeline in October West Record NGL production at Wamsutter/Echo Springs 41 MMbbls/d Northwest…
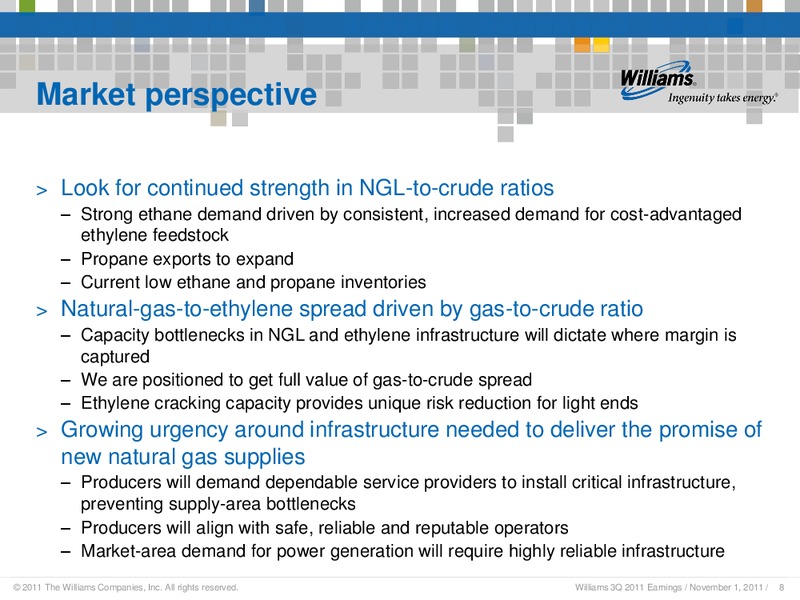
Market perspective Look for continued strength in NGL-to-crude ratios Strong ethane demand driven by consistent, increased demand for cost-advantaged ethylene feedstock Propane exports to expand Current low ethane and propane…
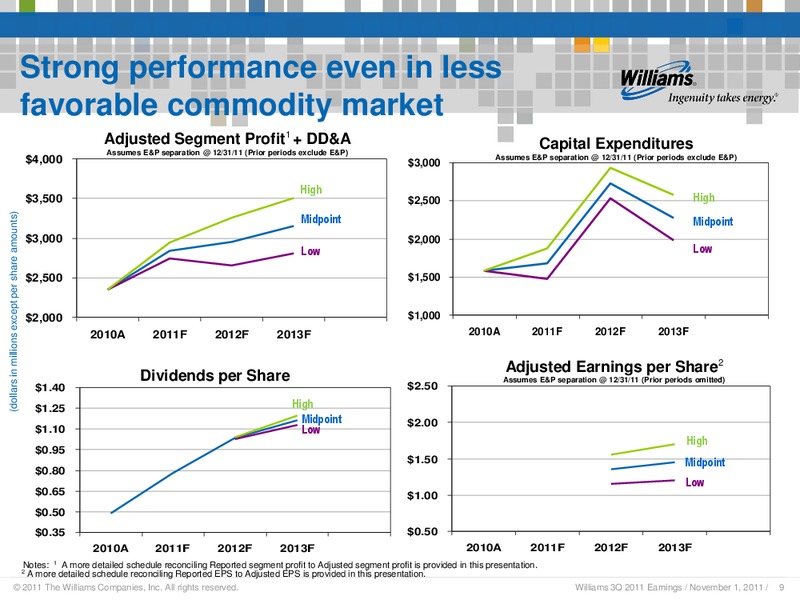
Strong performance even in less favorable commodity market Adjusted Segment Profit1 + DD&A Capital Expenditures Assumes E&P separation 12/31/11 (Prior periods exclude E&P) 4,000 Assumes E&P separation 12/31/11 (Prior periods exclude…
Future growth in the headlines Balancing overall ethane exposure with expansion of ethylene production Announced expansion of ethylene capacity at our Geismar, La., plant to 1.95 billion lbs with 0.6 billion lbs of new capacity; 3Q…
Visibility to growth in all areas Growth Capital Spending by Supply and Market Areas 2011-2013 2011-2016 4,600 5,800 8,350 10,500 14,450 16,900 In guidance In guidance Under negotiation In guidance Under negotiation Potential…
Unlocking value, seizing growth Unlocking value Creating separate exploration and production company Premier energy infrastructure company Right assets, right markets, right strategy MLP structure enables Williams high growth and…
2011 The Williams Companies, Inc. All rights reserved.
Non-GAAP Reconciliations 2011 The Williams Companies, Inc. All rights reserved.
Non-GAAP reconciliation schedule Reconciliation of Income (Loss) from Continuing Operations Attributable to The Williams Companies, Inc. to Adjusted Income (UNAUDITED) 2010 2011 (Dollars in millions, except per-share amounts) 1st Qtr…
Non-GAAP reconciliation schedule cont. Other (Gain)/loss from Venezuela investment - (13) (30) - (43) (11) - - (11) Total Other adjustments - (13) (30) - (43) (11) - - (11) Adjustments included in segment profit (loss) (14) (37)…
Non-GAAP reconciliation schedule adjusted segment profit (loss) Reconciliation of Segment Profit (Loss) to Adjusted Segment Profit (Loss) (UNAUDITED) 2010 2011 (Dollars in millions) 1st Qtr 2nd Qtr 3rd Qtr 4th Qtr Year 1st Qtr…
2011 forecast non-GAAP adjustment detail Segment Profit Adjustments: in millions Wi l l i a ms Pa rtners Ga i n on s a l e of ba s e ga s from Hes ter s tora ge fi el d (4) Los s rel a ted to Emi nence s tora ge fa ci l i ty l ea k…
2011 forecast guidance Pre E&P Separation reported to adjusted 2011 forecast guidance - reported to adjusted November 1 Guidance Dollars in millions Reported Adjustment Adjusted Low - High Items Low - High Segment profit 2,307 -…
Segment profit guidance reported to adjusted Dollars in millions 2011 Guidance 2012 Guidance 2013 Guidance PRE E&P SEPARATION POST E&P SEPARATION -- DOES NOT INCLUDE EXPLOR. & PROD. Low Midpoint High Low Midpoint High Low Midpoint…
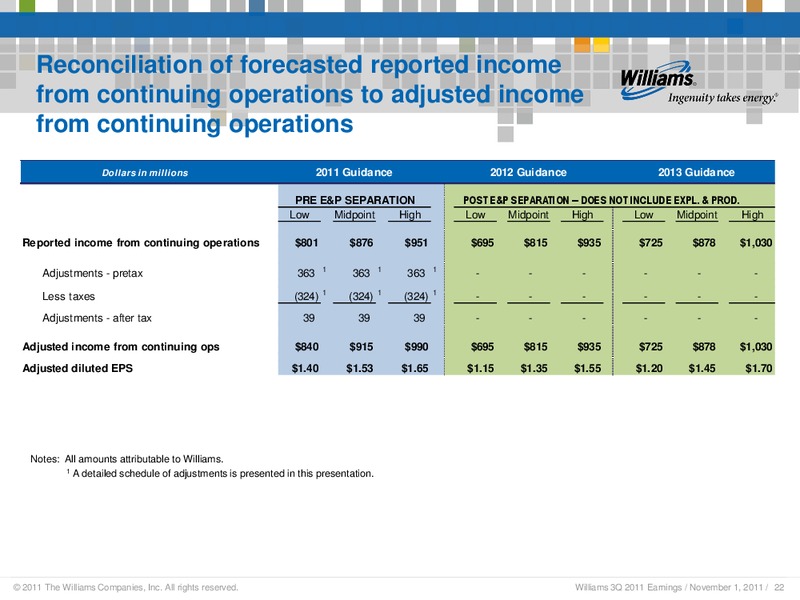
Reconciliation of forecasted reported income from continuing operations to adjusted income from continuing operations Dollars in millions 2011 Guidance 2012 Guidance 2013 Guidance PRE E&P SEPARATION POST E&P SEPARATION -- DOES NOT…
2011 The Williams Companies, Inc. All rights reserved.
 Loading...