Year-End 2011 Earnings Alan Armstrong, Chief Executive Officer February 22, 2012 2012 The Williams Companies, Inc. All rights reserved.
Williams: Premier high-growth, high-dividend energy infrastructure Transformed Williams Right assets, right markets, right strategy MLP structure enables Williams high growth and high dividend High-dividend payout; expect increases…
2011: Strong financial performance 37% growth in adjusted income from continuing ops Strong business performance Williams Partners (WPZ) Midstream Canada & Olefins 24% higher full-year adjusted segment profit 67% higher full-year…
Visibility to growth in all areas Growth Capital Spending by Supply and Market Areas 2012-2013 2012-2016 4,590-5,410 10,950-13,750 19,215-23,215 In guidance In guidance Under negotiation In guidance Under negotiation Potential…
3 Bcf/d Susquehanna Supply Hub Creating significant supply hub with access to best markets Planning access to 3 Bcf/d of takeaway capacity by 2015 Key customers include Cabot, WPX Energy, Carrizo Susquehanna Supply Hub Key…
Proposed Atlantic Access pipeline Connecting Marcellus production with Transco markets Rivervale (Tenn) Butler Oakford Natrium Description S195 Firm path from receipt points in SW PA/WV and Pl. Valley (CPPL) Rivervale, NJ, in…
WPZ Midstream Keathley Canyon Connector Major expansion of the central Gulf of Mexico (Discovery) gas gathering system Over 200 miles of new large diameter deepwater gas pipeline Originating in southeast Keathley Canyon…
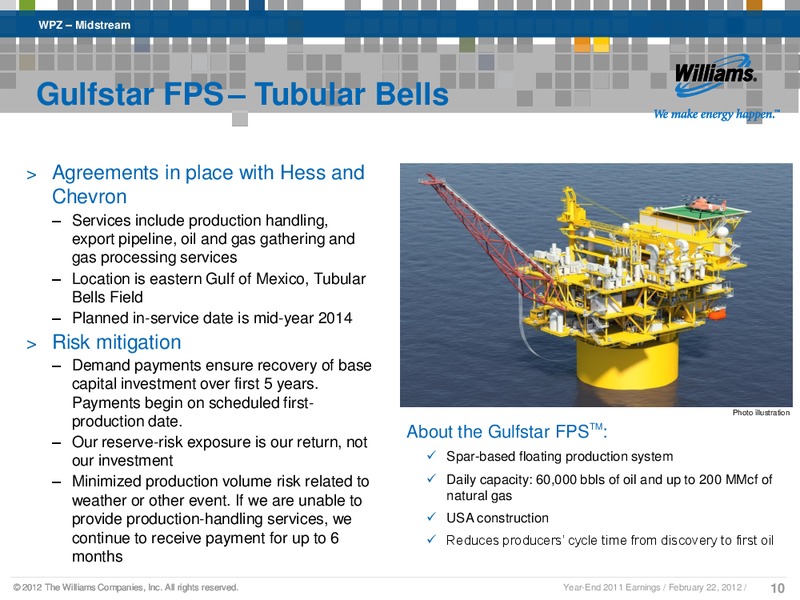
WPZ Midstream Gulfstar FPS Tubular Bells Agreements in place with Hess and Chevron Services include production handling, export pipeline, oil and gas gathering and gas processing services Location is eastern Gulf of Mexico,…
Growing our franchise western assets Expansion of the existing Parachute plant complex Additional 350 MMcfd high ethane recovery, cryogenic processing plant Capable of recovering 15-18 Mbpd, with ethane recoveries of 90%…
Visibility to 3.5 billion in growth N Seattle Lateral Constitution NE Connector/ Nov. 12 March 2015 Rockaway Lateral As early as April 14 S Seattle Lateral NE Supply Link 2013 Nov. 13 Atlantic Access Jackson Prairie As early…
Midstream Canada & Olefins Uniquely positioned to open up NGL market out of Fort McMurray Boreal Pipeline Low-risk investment utilizes Williams international cash reserves 261-mile NGL pipeline from Fort McMurray to Redwater…
Midstream Canada & Olefins Offgas ethane recovery project Offgas Ethane Project Long-term ethane sale to NOVA Chemicals up to 17,000 bpd Capacity for Suncor ethane + one more upgrader Expected 1Q 2013 in-service 265MM -…
Midstream Canada & Olefins Geismar plant expansion capitalizes on competitive advantages Preliminary engineering complete; detailed engineering under way Expansion targets Completion 3Q 2013 600 million pounds per year of…
Our perspective on industry fundamentals Crude to gas ratio continues at record highs NGL-to-crude ratio 1Q started strong, but current ratios drifting lower Expect ratios to strengthen in second half of 2012…
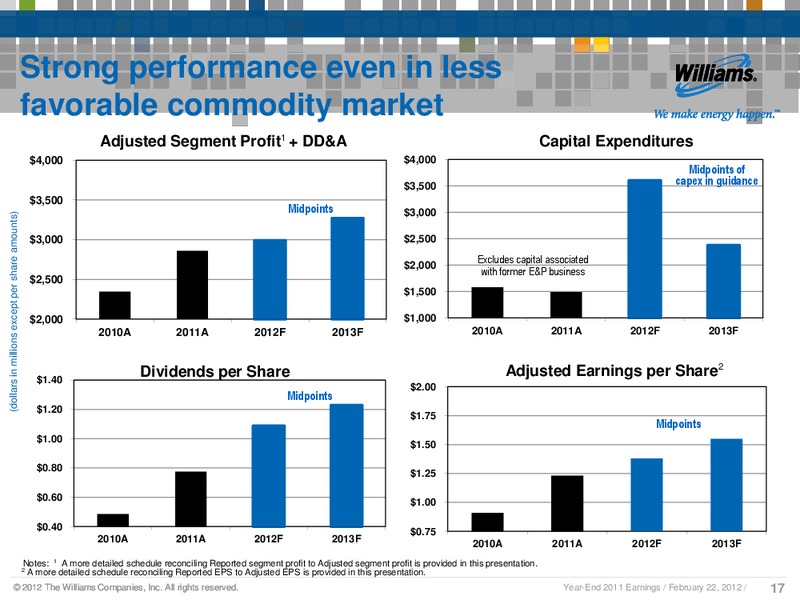
Strong performance even in less favorable commodity market Adjusted Segment Profit1 + DD&A Capital Expenditures 4,000 4,000 Midpoints of 3,500 capex in guidance 3,500 Midpoints 3,000 (dollars in millions except per share…
Williams: Premier high-growth, high-dividend energy infrastructure Transformed Williams Right assets, right markets, right strategy MLP structure enables Williams high growth and high dividend High-dividend payout; expect increases…
WMB Non-GAAP Reconciliations 2012 The Williams Companies, Inc. All rights reserved.
WMB non-GAAP reconciliation schedule Reconciliation of Income (Loss) from Continuing Operations Attributable to The Williams Companies, Inc. to Adjusted Income (UNAUDITED) 2010* 2011 (Dollars in millions, except per-share amounts)…
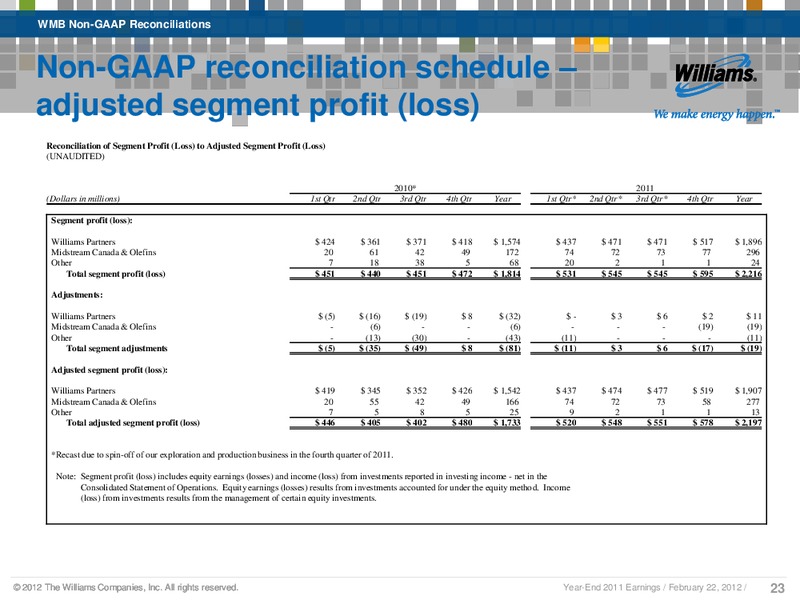
WMB Non-GAAP Reconciliations Non-GAAP reconciliation schedule adjusted segment profit (loss) Reconciliation of Segment Profit (Loss) to Adjusted Segment Profit (Loss) (UNAUDITED) 2010* 2011 (Dollars in millions) 1st Qtr 2nd…
WMB Non-GAAP Reconciliations 2012 forecast guidance reported to adjusted February 22 Guidance Dollars in millions Reported Adjustment Adjusted Low - High Items Low - High Segment profit 1,975 - 2,575 1,975 - 2,575 Net…
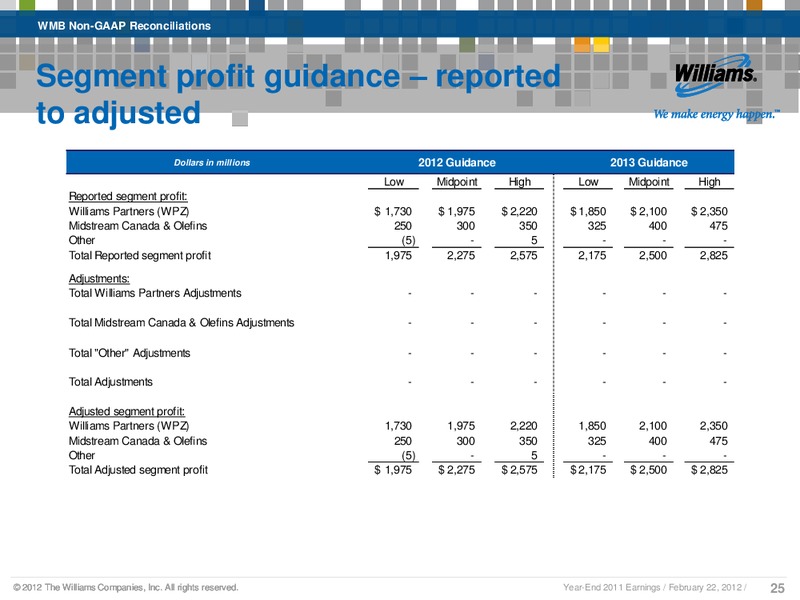
WMB Non-GAAP Reconciliations Segment profit guidance reported to adjusted Dollars in millions 2012 Guidance 2013 Guidance Low Midpoint High Low Midpoint High Reported segment profit: Williams Partners (WPZ) 1,730 1,975 2,220…
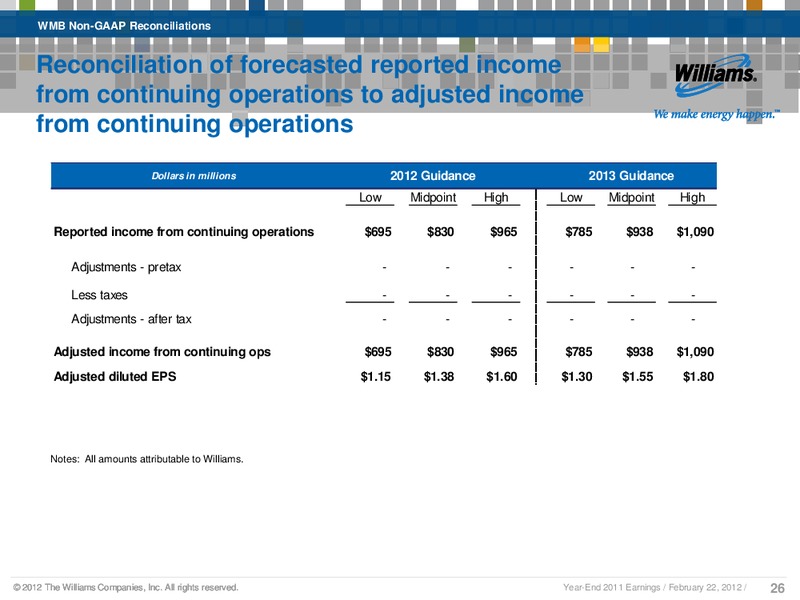
WMB Non-GAAP Reconciliations Reconciliation of forecasted reported income from continuing operations to adjusted income from continuing operations Dollars in millions 2012 Guidance 2013 Guidance Low Midpoint High Low Midpoint…
 Loading...