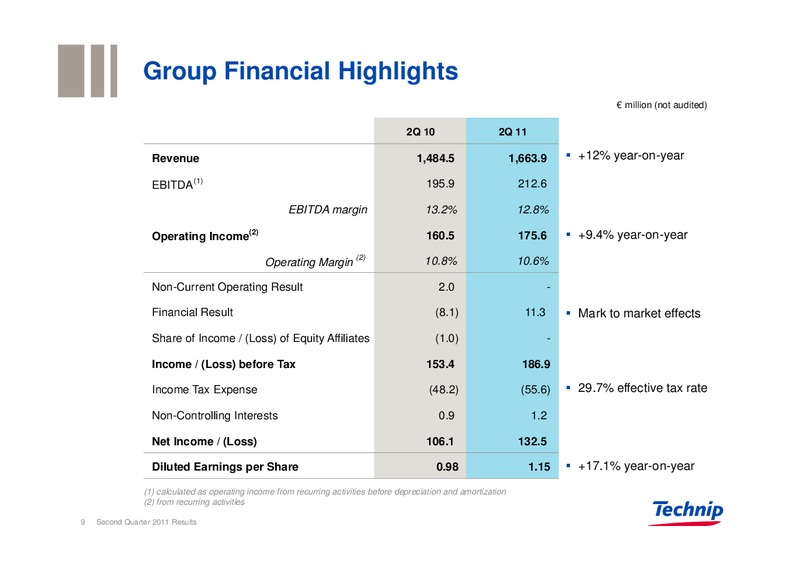
Second Quarter 2011 Results July 28, 2011 1 Second Quarter 2011 Results
Contents 1. Second Quarter 2011 Operational Highlights 2. Second Quarter 2011 Financial Highlights 3. Strategy and Outlook 4. Annex 2 Second Quarter 2011 Results
1. Second Quarter 2011 Operational Highlights 3 Second Quarter 2011 Results
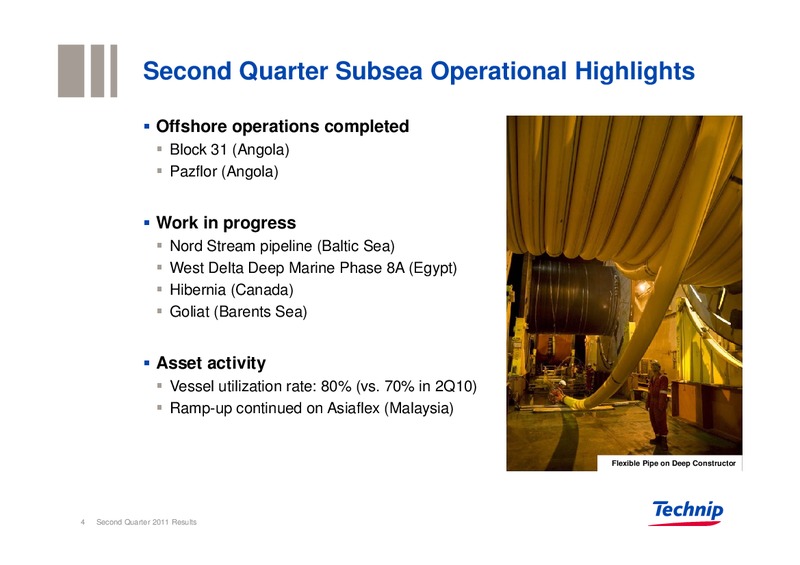
Second Quarter Subsea Operational Highlights Offshore operations completed Block 31 (Angola) Pazflor (Angola) Work in progress Nord Stream pipeline (Baltic Sea) West Delta Deep Marine Phase 8A (Egypt) Hibernia (Canada) Goliat…
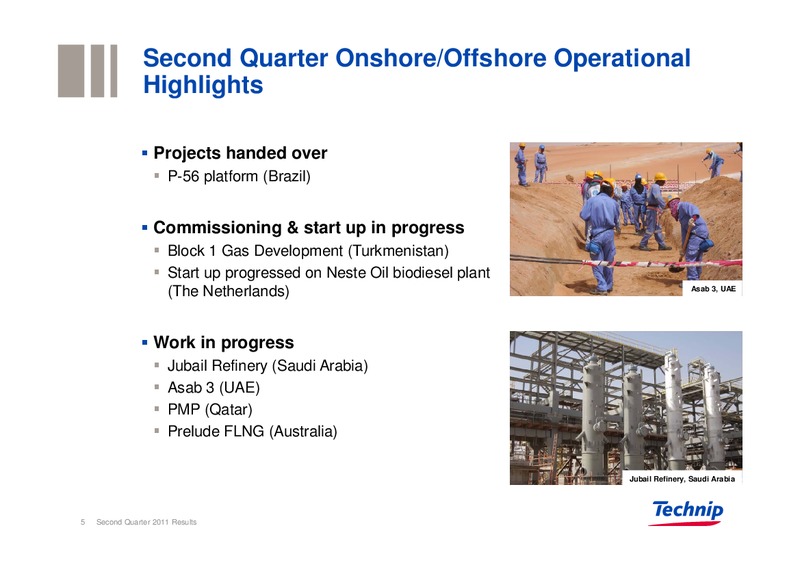
Second Quarter Onshore/Offshore Operational Highlights Projects handed over P-56 platform (Brazil) Commissioning & start up in progress Block 1 Gas Development (Turkmenistan) Start up progressed on Neste Oil biodiesel plant…
2. Second Quarter 2011 Financial Highlights 6 Second Quarter 2011 Results
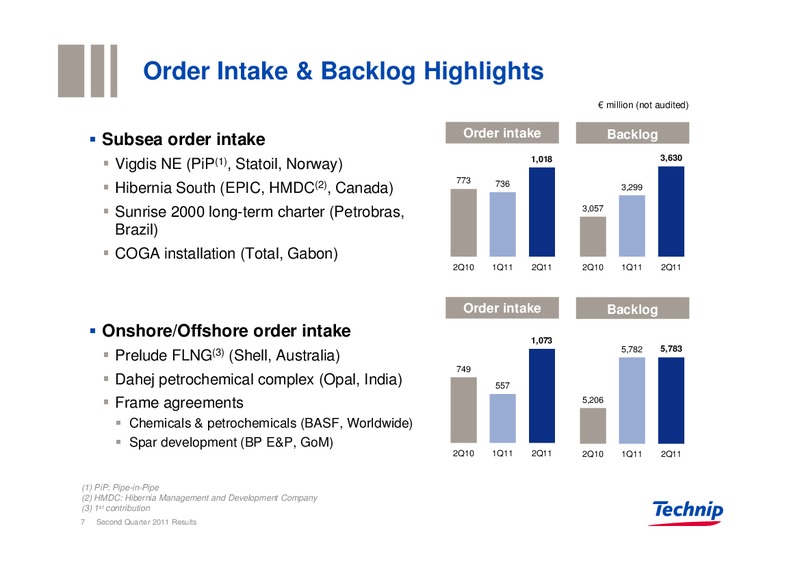
Order Intake & Backlog Highlights million (not audited) Order intake Backlog Subsea order intake 3,630 Vigdis NE (PiP(1), Statoil, Norway) 1,018 773 Hibernia South (EPIC, HMDC(2), Canada) 736 3,299 Sunrise 2000 long-term…
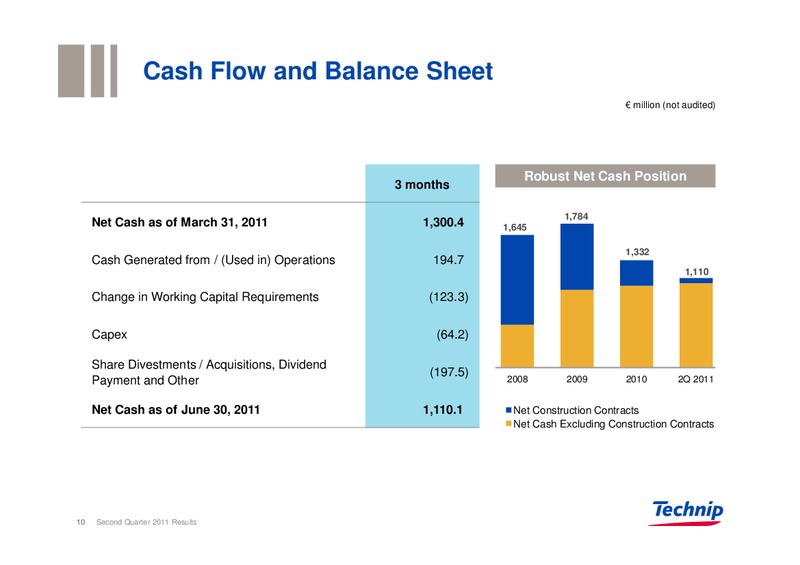
Cash Flow and Balance Sheet million (not audited) Robust Net Cash Position 3 months 1,784 Net Cash as of March 31, 2011 1,300.4 1,645 1,332 Cash Generated from / (Used in) Operations 194.7 1,110 Change in Working Capital…
3. Strategy and Outlook 11 Second Quarter 2011 Results
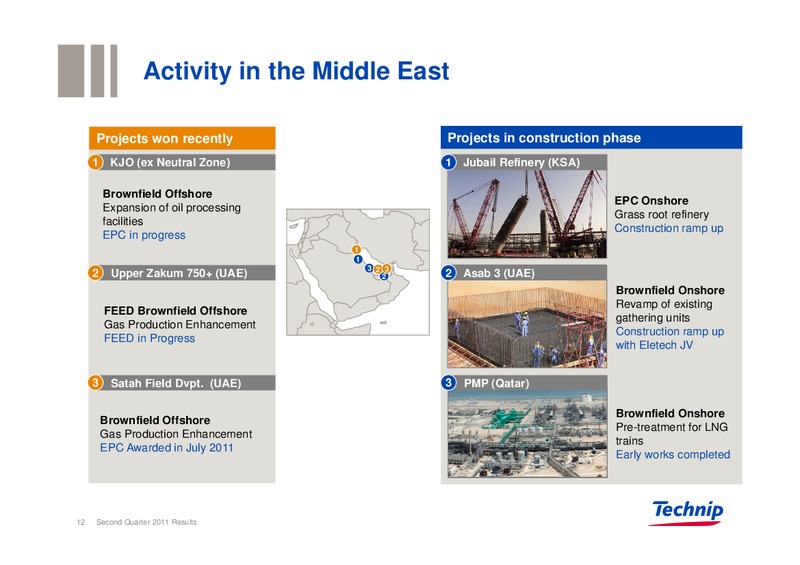
Activity in the Middle East Projects won recently Projects in construction phase 1 KJO (ex Neutral Zone) 1 Jubail Refinery (KSA) Brownfield Offshore EPC Onshore Expansion of oil processing Grass root refinery facilities…
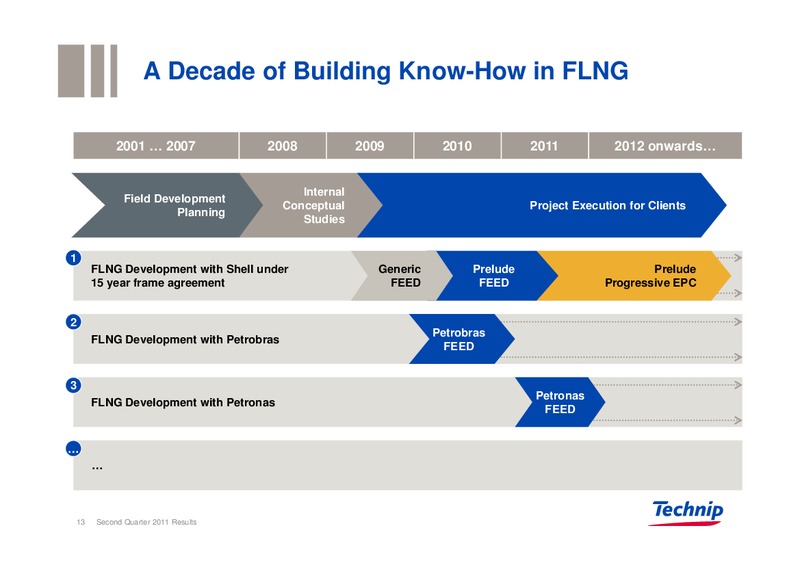
A Decade of Building Know-How in FLNG 2001 2007 2008 2009 2010 2011 2012 onwards Internal Field Development Conceptual Project Execution for Clients Planning Studies 1 FLNG Development with Shell under Generic Prelude…
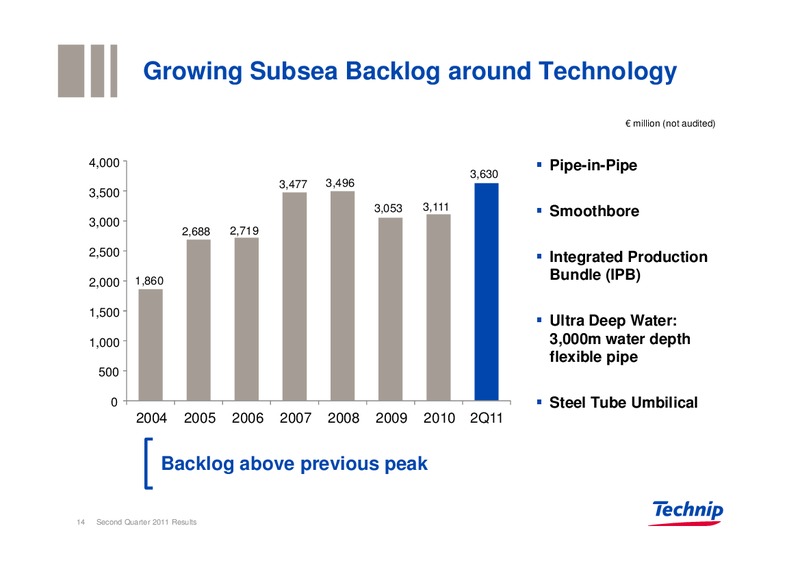
Growing Subsea Backlog around Technology million (not audited) 4,000 Pipe-in-Pipe 3,630 3,477 3,496 3,500 3,053 3,111 Smoothbore 3,000 2,688 2,719 2,500 Integrated Production 2,000 1,860 Bundle (IPB) 1,500 Ultra Deep…
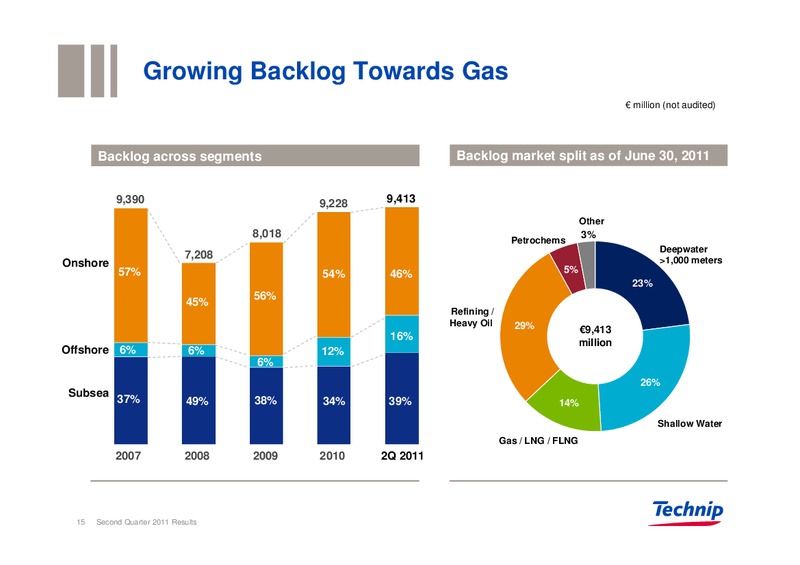
Growing Backlog Towards Gas million (not audited) Backlog across segments Backlog market split as of June 30, 2011 9,390 9,228 9,413 Other 8,018 3% Petrochems Deepwater 7,208 1,000 meters Onshore 57% 54% 46% 5% 23% 56%…
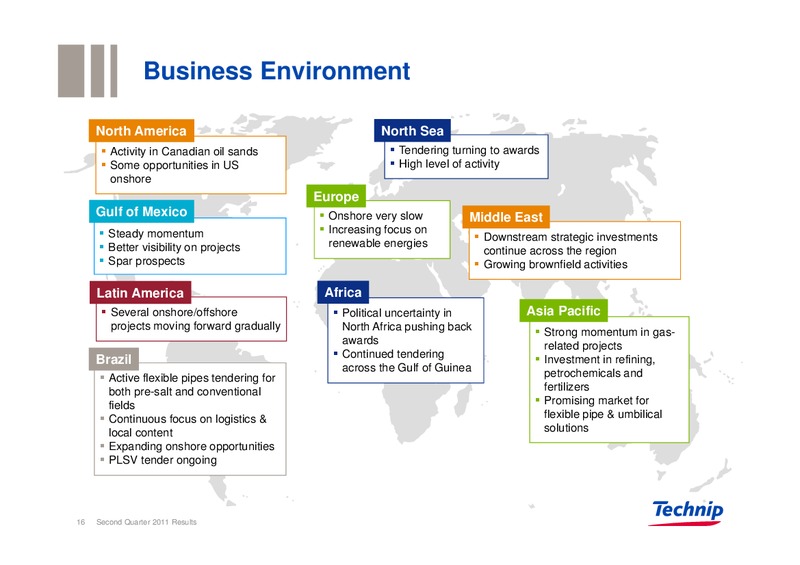
Business Environment North America North Sea Activity in Canadian oil sands Tendering turning to awards Some opportunities in US High level of activity onshore Europe Gulf of Mexico Onshore very slow Middle East Steady momentum…
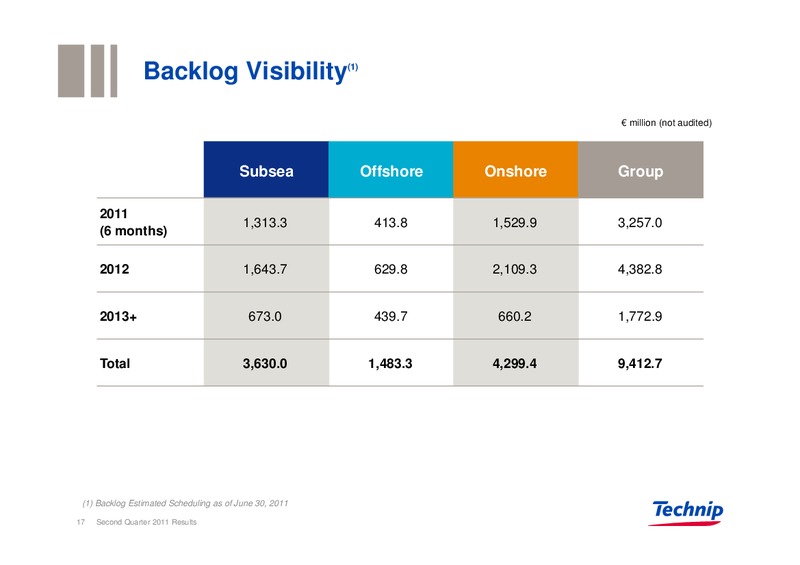
Backlog Visibility (1) million (not audited) Subsea Offshore Onshore Group 2011 1,313.3 413.8 1,529.9 3,257.0 (6 months) 2012 1,643.7 629.8 2,109.3 4,382.8 2013+ 673.0 439.7 660.2 1,772.9 Total 3,630.0 1,483.3…
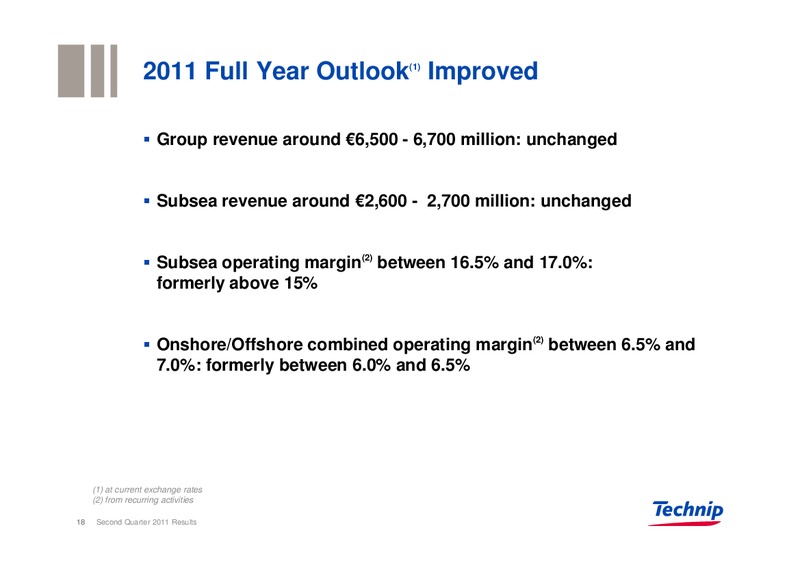
2011 Full Year Outlook Improved(1) Group revenue around 6,500 - 6,700 million: unchanged Subsea revenue around 2,600 - 2,700 million: unchanged Subsea operating margin(2) between 16.5% and 17.0%: formerly above 15%…
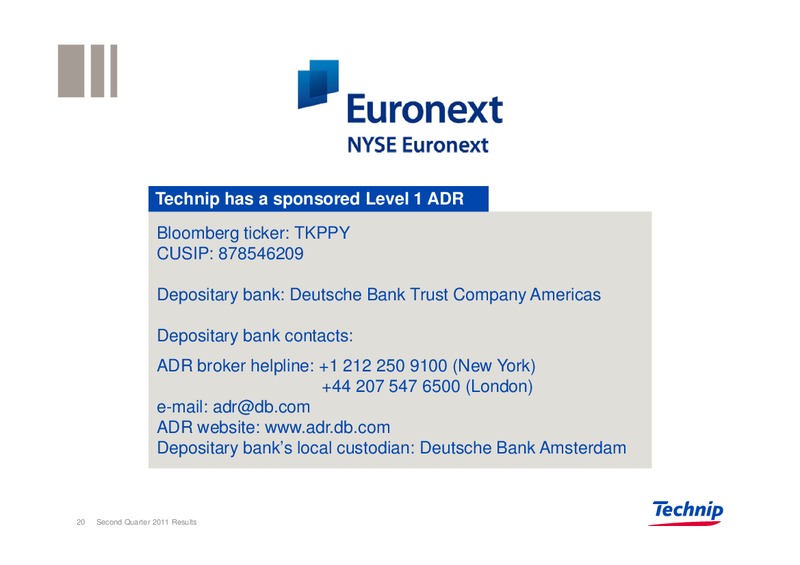
Technip has a sponsored Level 1 ADR Bloomberg ticker: TKPPY CUSIP: 878546209 Depositary bank: Deutsche Bank Trust Company Americas Depositary bank contacts: ADR broker helpline: +1 212 250 9100 (New York) +44 207 547 6500…
4. Annex 22 Second Quarter 2011 Results
Second Quarter 2011 23 Second Quarter 2011 Results
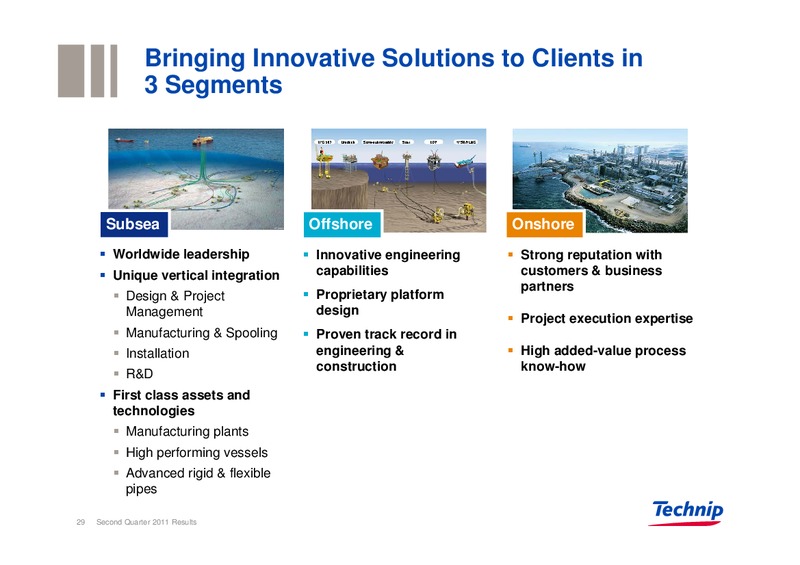
Bringing Innovative Solutions to Clients in 3 Segments Subsea Offshore Onshore Worldwide leadership Innovative engineering Strong reputation with Unique vertical integration capabilities customers & business partners Design &…
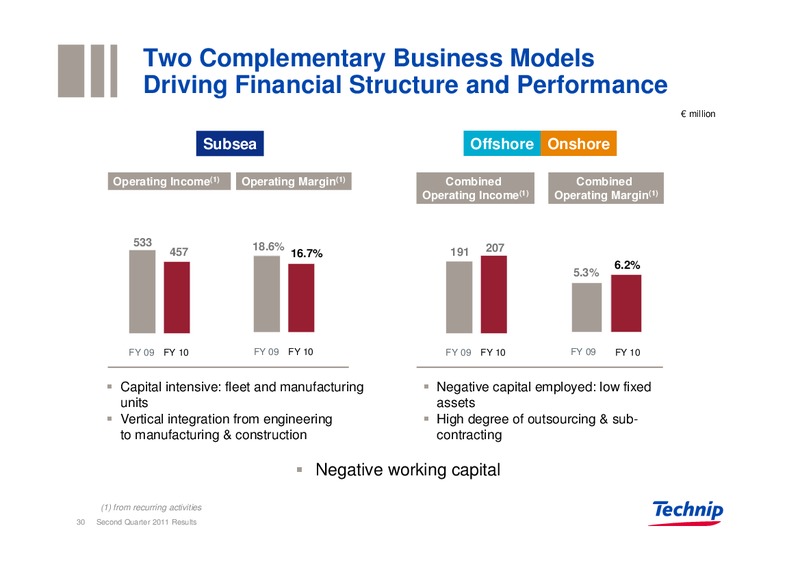
Two Complementary Business Models Driving Financial Structure and Performance million Subsea Offshore Onshore Operating Income(1) Operating Margin(1) Combined Combined Operating Income(1) Operating Margin(1) 533 18.6% 207…
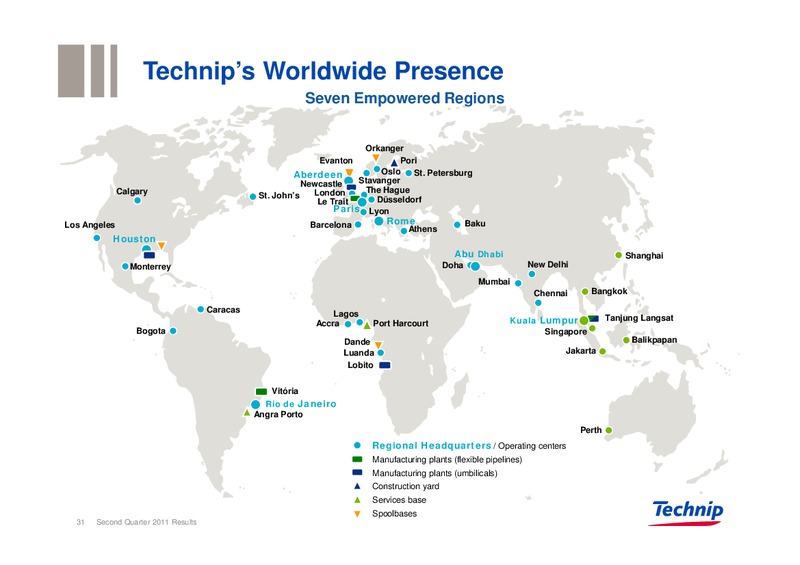
Technips Worldwide Presence Seven Empowered Regions Orkanger Evanton Pori Aberdeen Oslo St. Petersburg Newcastle Stavanger Calgary London The Hague St. Johns Dsseldorf Le Trait Paris Lyon Los Angeles Barcelona Rome Baku…
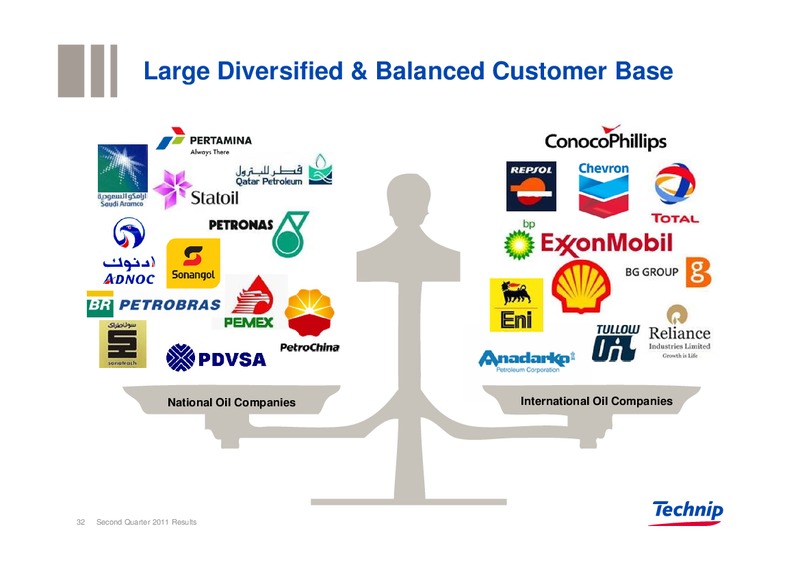
Large Diversified & Balanced Customer Base National Oil Companies International Oil Companies 32 Second Quarter 2011 Results
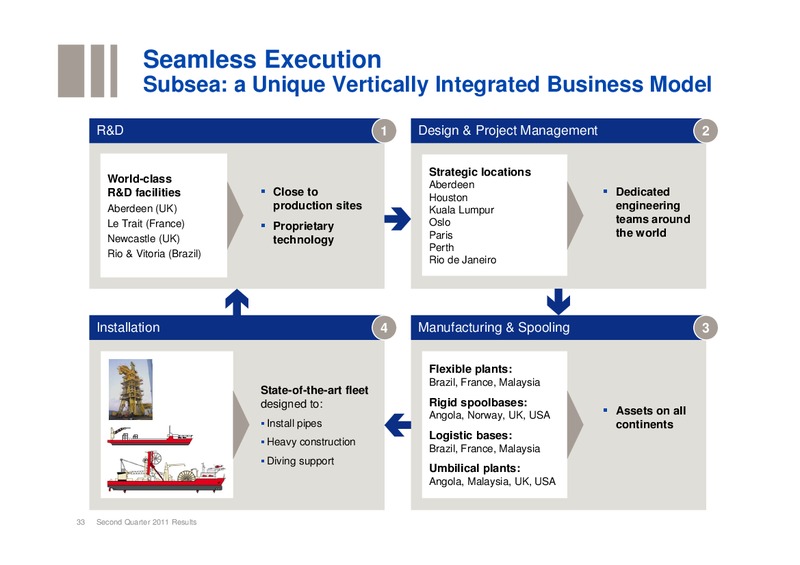
Seamless Execution Subsea: a Unique Vertically Integrated Business Model R&D 1 Design & Project Management 2 Strategic locations World-class Aberdeen R&D facilities Close to Houston Dedicated Aberdeen (UK) production sites Kuala…
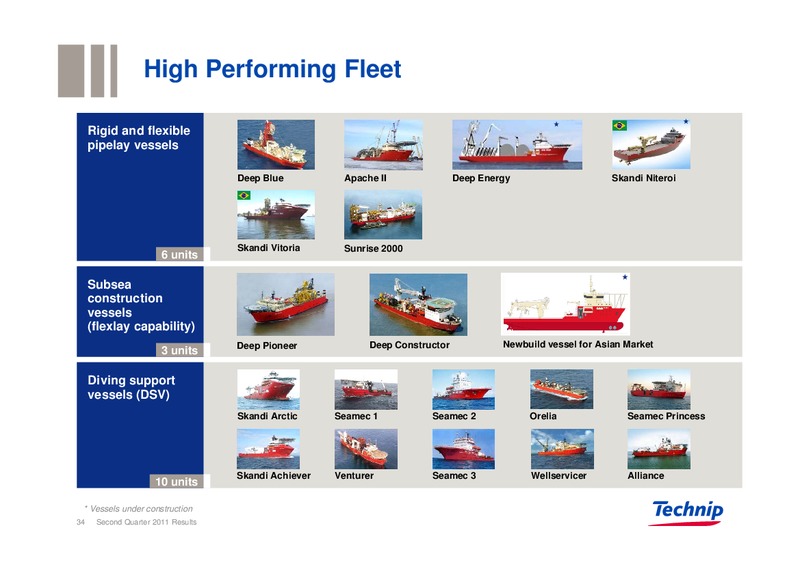
High Performing Fleet Rigid and flexible pipelay vessels Deep Blue Apache II Deep Energy Skandi Niteroi Skandi Vitoria Sunrise 2000 6 units Subsea construction vessels (flexlay capability) Deep Pioneer Deep Constructor…
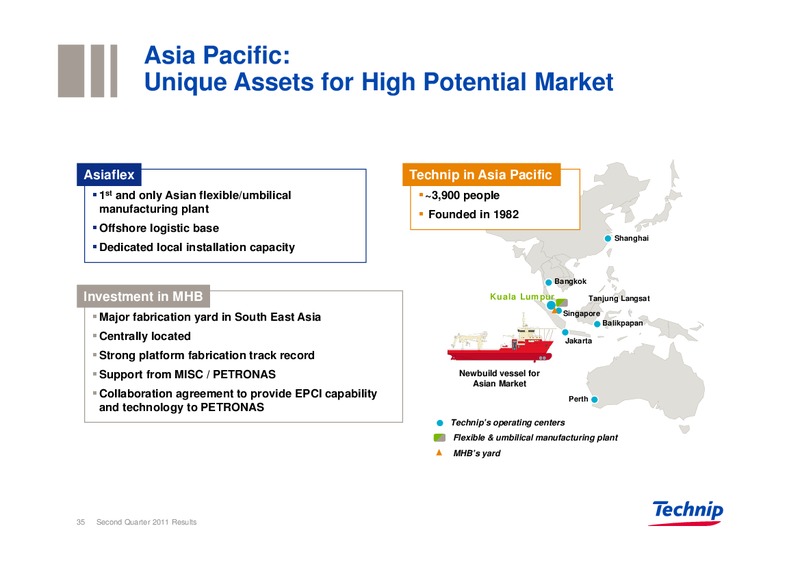
Asia Pacific: Unique Assets for High Potential Market Asiaflex Technip in Asia Pacific 1st and only Asian flexible/umbilical 3,900 people manufacturing plant Founded in 1982 Offshore logistic base Shanghai Dedicated local…
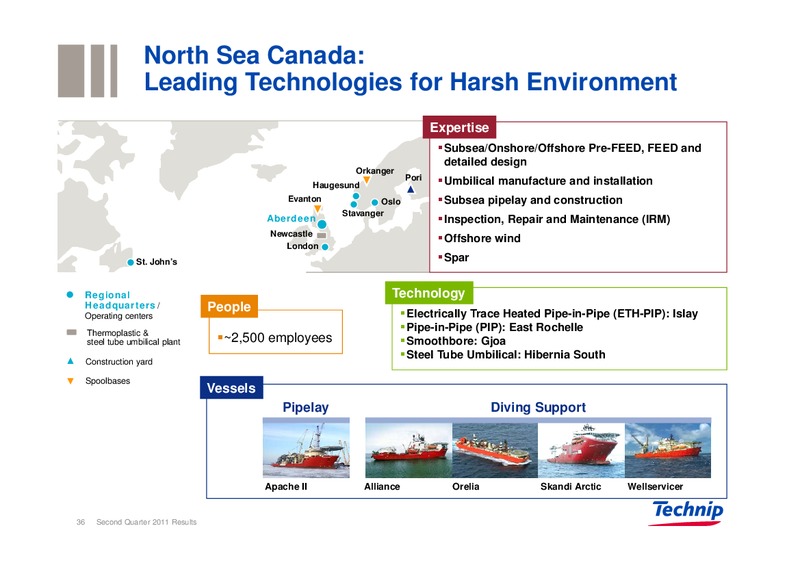
North Sea Canada: Leading Technologies for Harsh Environment Expertise Subsea/Onshore/Offshore Pre-FEED, FEED and detailed design Orkanger Haugesund Pori Umbilical manufacture and installation Evanton Oslo Subsea pipelay and…
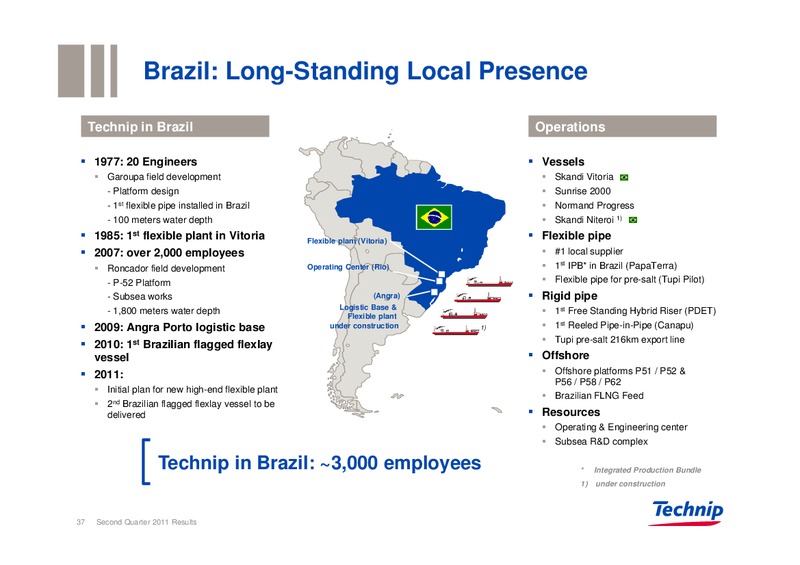
Brazil: Long-Standing Local Presence Technip in Brazil Operations 1977: 20 Engineers Vessels Garoupa field development Skandi Vitoria - Platform design Sunrise 2000 - 1st flexible pipe installed in Brazil Normand Progress - 100…
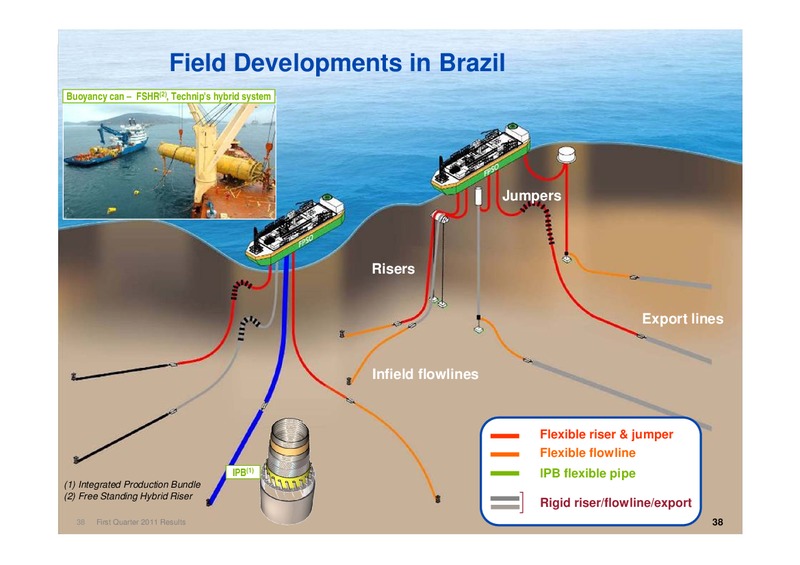
Field Developments in Brazil Buoyancy can FSHR(2), Technip's hybrid system Jumpers 38 Risers Export lines Infield flowlines Flexible riser & jumper Flexible flowline IPB(1) IPB flexible pipe (1) Integrated…
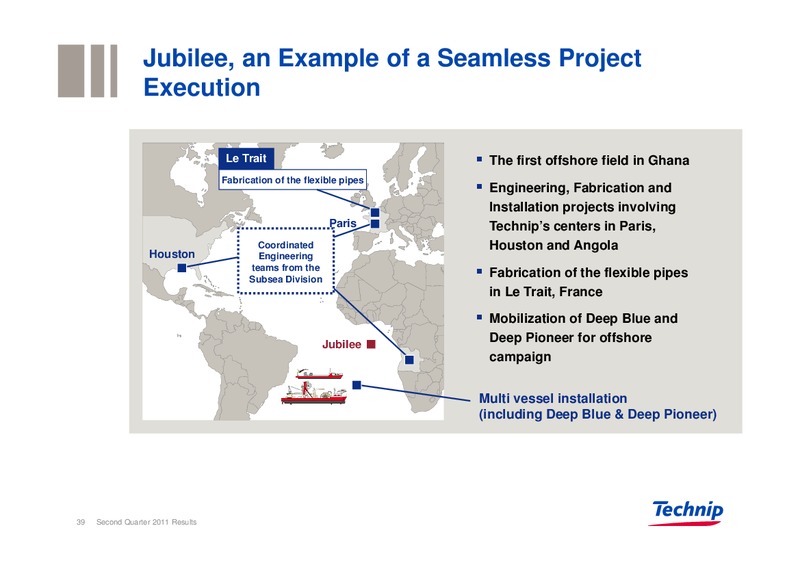
Jubilee, an Example of a Seamless Project Execution Le Trait The first offshore field in Ghana Fabrication of the flexible pipes Engineering, Fabrication and Installation projects involving Paris Technips centers in Paris,…
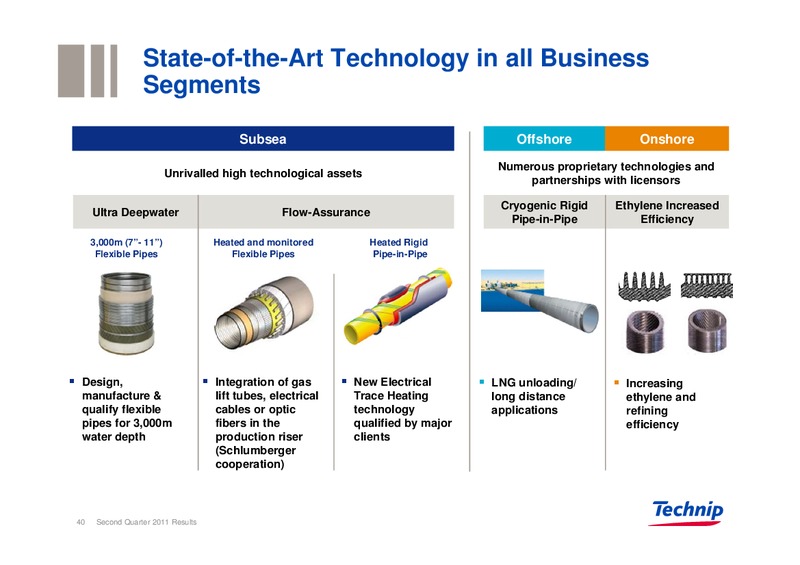
State-of-the-Art Technology in all Business Segments Subsea Offshore Onshore Numerous proprietary technologies and Unrivalled high technological assets partnerships with licensors Cryogenic Rigid Ethylene Increased Ultra…
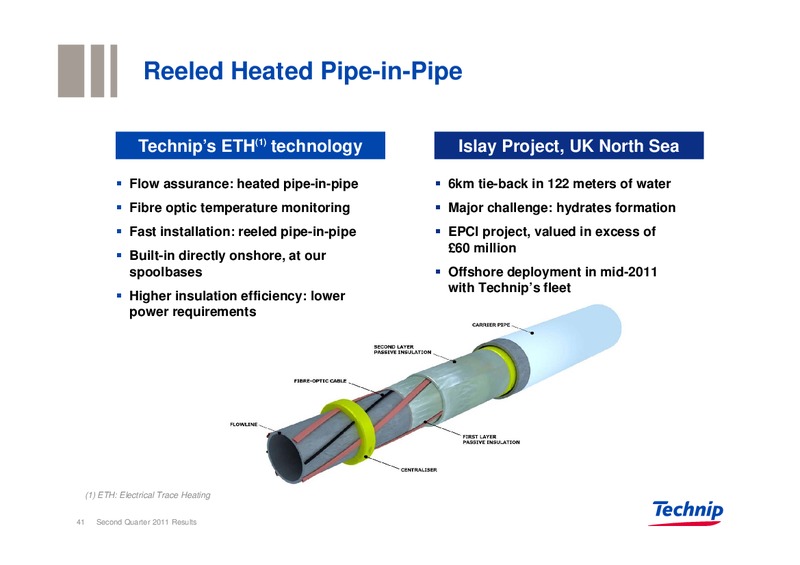
Reeled Heated Pipe-in-Pipe Technips ETH(1) technology Islay Project, UK North Sea Flow assurance: heated pipe-in-pipe 6km tie-back in 122 meters of water Fibre optic temperature monitoring Major challenge: hydrates formation Fast…
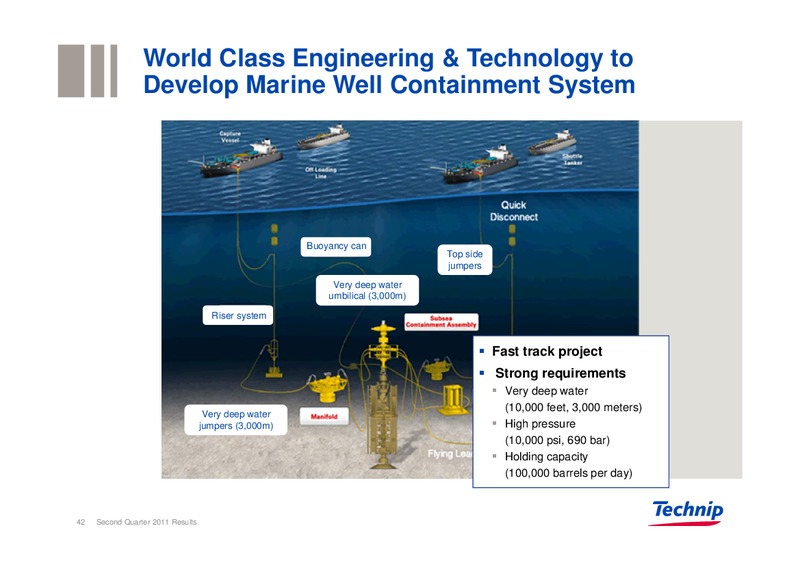
World Class Engineering & Technology to Develop Marine Well Containment System Buoyancy can Top side jumpers Very deep water umbilical (3,000m) Riser system Fast track project Strong requirements Very deep water…
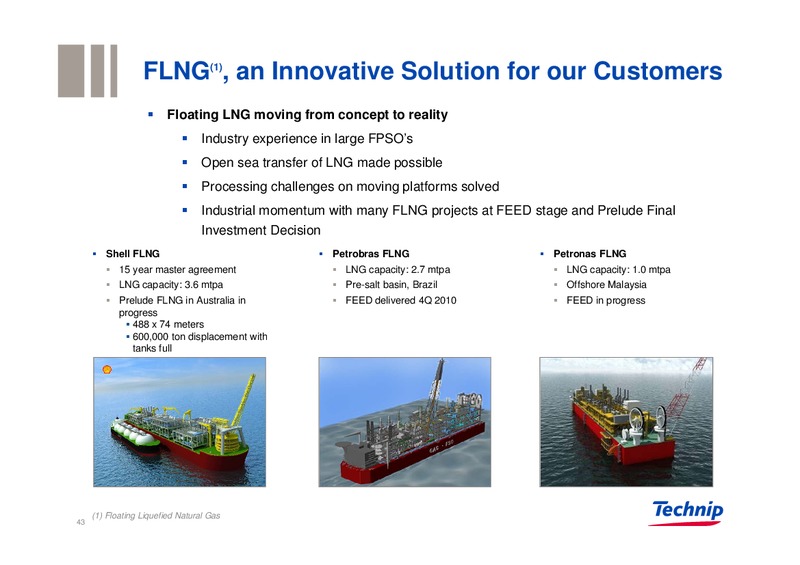
FLNG(1), an Innovative Solution for our Customers Floating LNG moving from concept to reality Industry experience in large FPSOs Open sea transfer of LNG made possible Processing challenges on moving platforms solved Industrial…
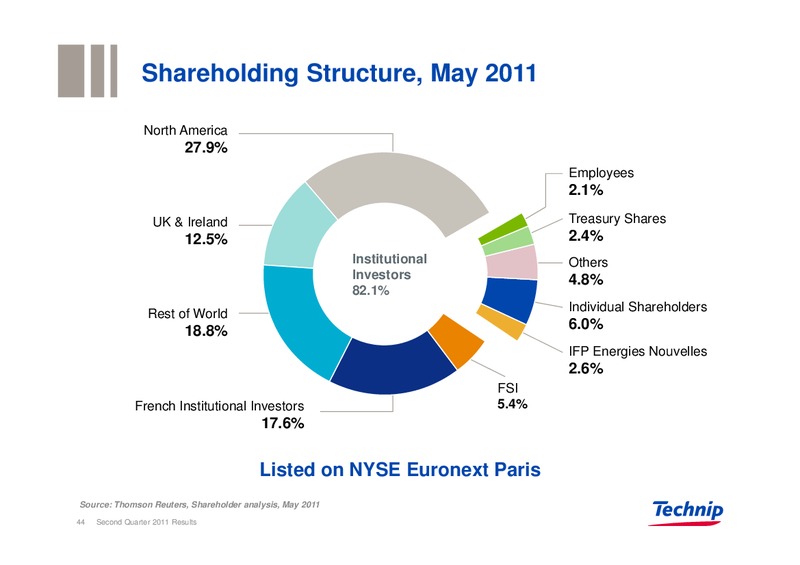
Shareholding Structure, May 2011 North America 27.9% Employees 2.1% UK & Ireland Treasury Shares 12.5% 2.4% Institutional Others Investors 4.8% 82.1% Individual Shareholders Rest of World 18.8% 6.0% IFP Energies Nouvelles…
 Loading...